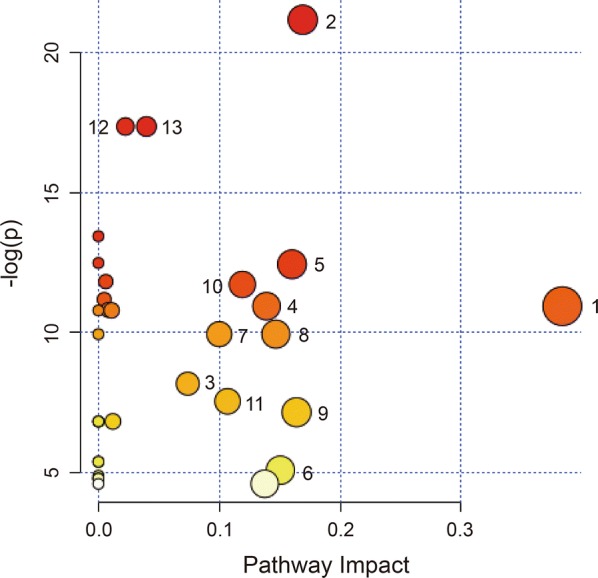
Fig. 6.

Bubble plots showing altered metabolic pathways perturbed by HAE. Bubble area is proportional to the impact of each pathway with colour denoting the significance from highest (in red) to lowest (in white). Key: 1, alanine, aspartate and glutamate metabolism; 2, aminoacyl-tRNA biosynthesis; 3, arginine and proline metabolism; 4, d-glutamine and d-glutamate metabolism; 5, glycine, serine and threonine metabolism; 6, glyoxylate and dicarboxylate metabolism; 7, lysine biosynthesis; 8, lysine degradation; 9, methane metabolism; 10, phenylalanine metabolism; 11, tyrosine metabolism; 12, valine, leucine and isoleucine biosynthesis; 13, valine, leucine and isoleucine degradation
