Fig. 2.
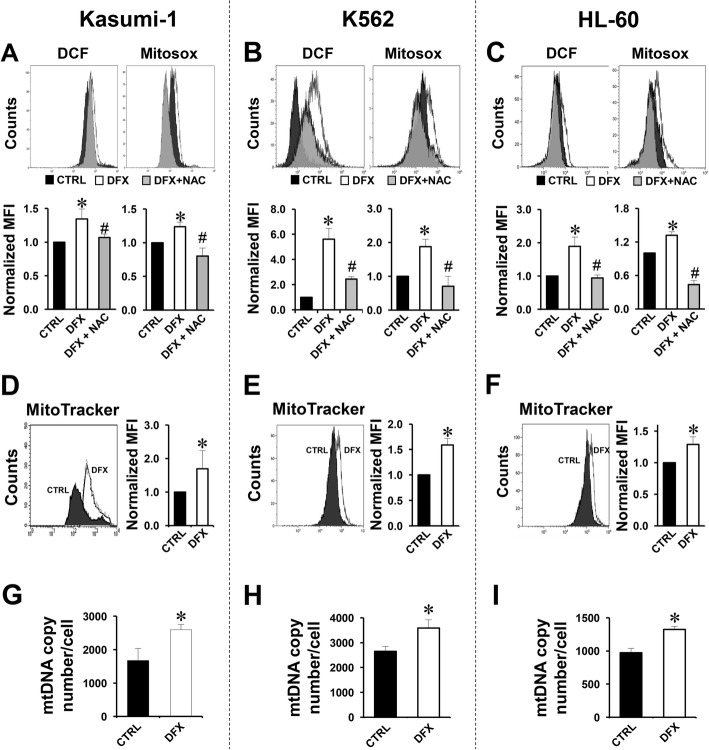
Effect of DFX on ROS production, mitochondrial mass and mtDNA in Kasumi-1, K562 and HL60. a–c Representative flow cytometric analysis of intracellular and mitochondrial ROS assessed by DCF (left panel) and Mitosox (right panel) probes in Kasumi-1 (a), K562 (b) and HL60 (c) treated with 100 μM DFX ± 10 mM NAC for 24 h. Bar histograms below each panel: normalized MFI of at least three experiments, expressed as mean ± SEM (*p < 0.05 vs CTRL, #p < 0.05 vs DFX). d–f Representative flow cytometry analysis of Mitotracker green distribution in Kasumi-1 (d), K562 (e) and HL-60 (f). Per cell line, untreated cell distribution is represented with a black area, and 100 μM DFX-treated cells are shown as a white area. The panel on the right shows the quantitative analysis of normalized MFI as average ± SEM of three independent experiments (*p < 0.05 vs CTRL). g–i mtDNA copy number assessed by q-RT-PCR in Kasumi-1 cells (g), K562 (h) and HL-60 (i); the bar histogram shows values normalized to the nuclear DNA and are means ± SEM of three independent determination on biological replicates (*p < 0.05 vs CTRL)

