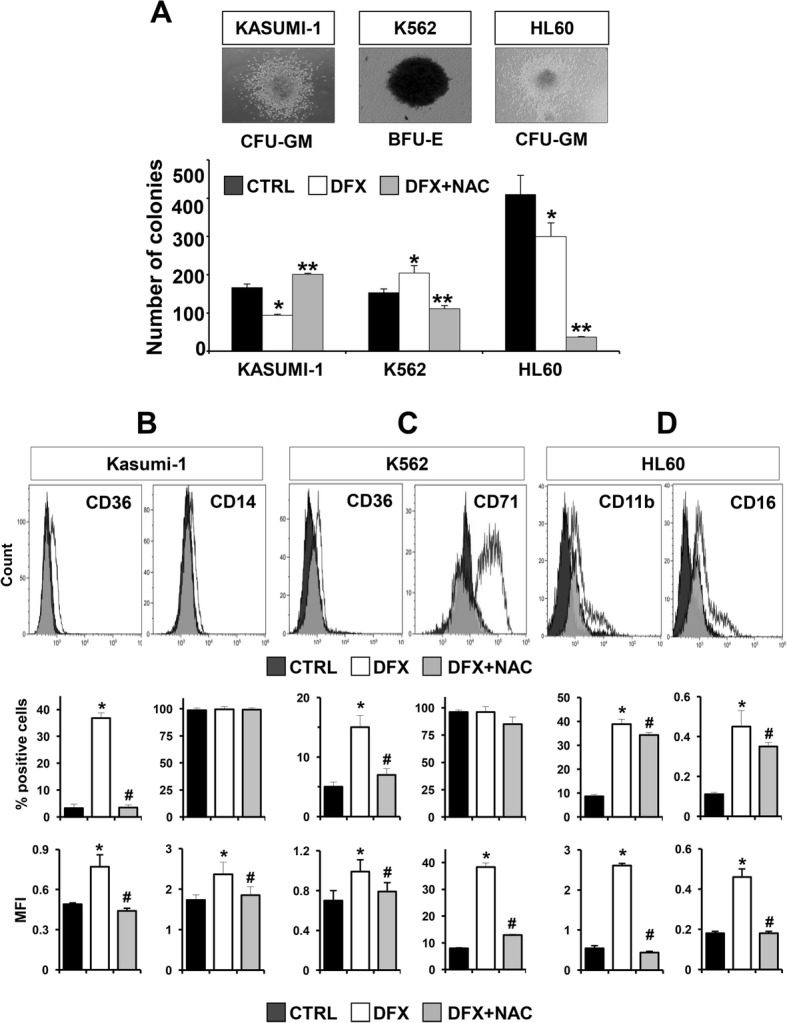
Fig. 3.

DFX affects colony formation ability and promotes expression of differentiation markers in leukemia cell lines. a Colony formation assay in Kasumi-1, K562 and HL60 treated with DFX and DFX + NAC. Representative images of colonies scored under an inverted microscope (magnification × 40) are shown on the top; left photo: CFU-GM from Kasumi-1 cells; central photo: BFU-E from K562 cells; right photo: CFU-GM from HL-60 cells. On the bottom, quantitative analysis of colonies derived by each cell line cultured without DFX, with 20 μM DFX and with 20 μM DFX + NAC 10 mM for 14 days in a methylcellulose-based medium. Colony number is shown as the mean ± SD of three independent experiments (*p < 0.05 vs CTRL). b Representative flow cytometric analysis of CD36 (on the left) and CD14 (on the right) distribution in untreated (CTRL—black area), DFX-treated (white area) and DFX + NAC (grey area) Kasumi-1 cells for 48 h. c Representative flow cytometric analysis of CD36 (on the left) and CD71 (on the right) distribution in untreated (CTRL—black area), DFX-treated (white area) and DFX + NAC (grey area) in K562 cells 48 h. d Representative flow cytometric analysis of CD11b (on the left) and CD16 (on the right) distribution in untreated (CTRL—black area), DFX-treated (white area) and DFX + NAC (grey area) in HL60 cells for 48 h. Per marker, histograms concerning both percentage of positive cells and MFI (expressed as mean ± SEM) are shown (*p < 0.05 vs CTRL, #p < 0.05 vs DFX)
