
Fig. 6.
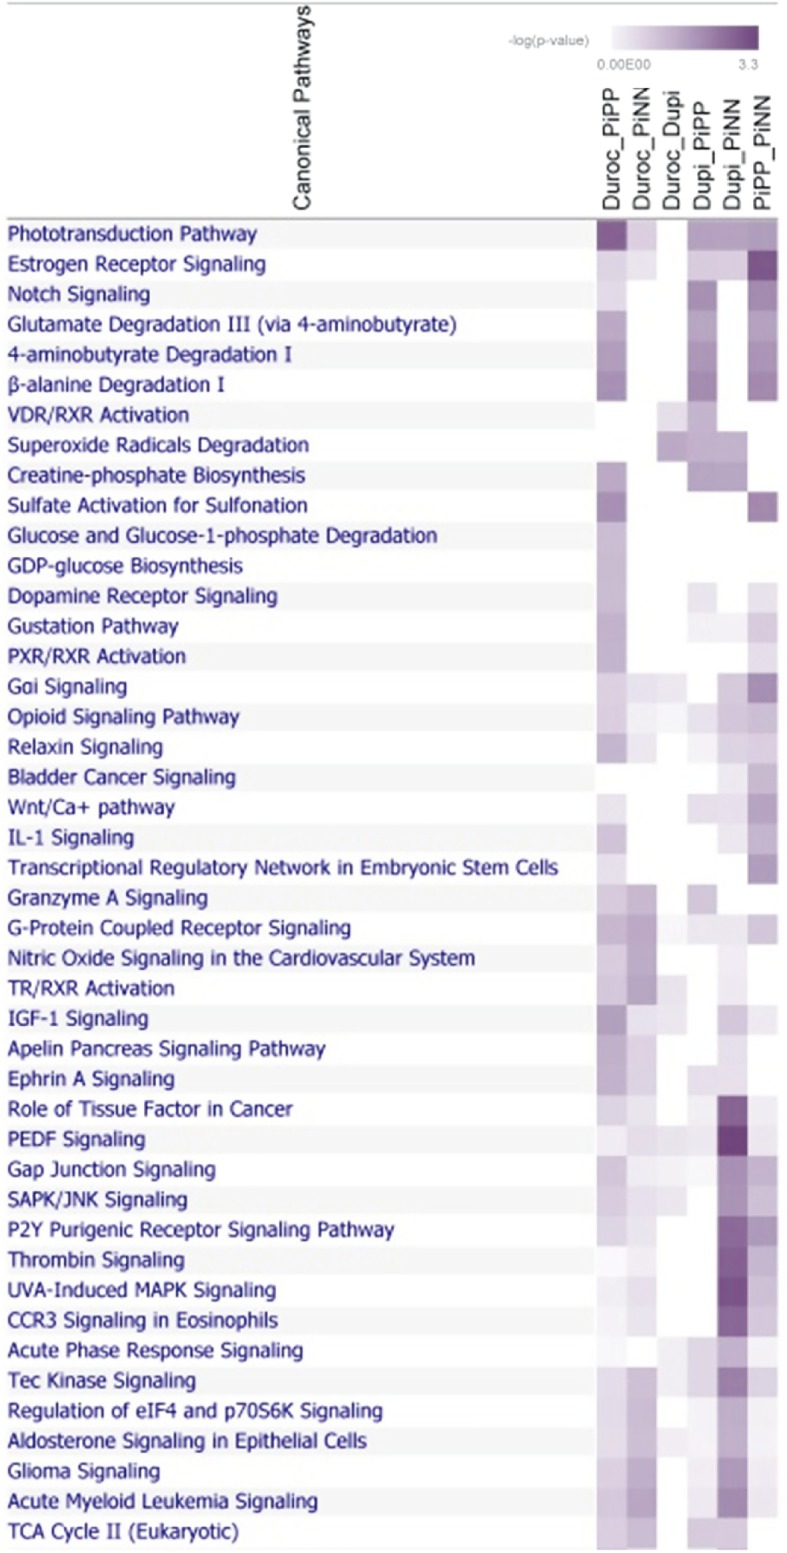
Heatmap indicating the enrichment of differently methylated transcripts between pig breeds in various canonical pathways; intensity of color indicates significance from light to dark
Official websites use .gov
A
.gov website belongs to an official
government organization in the United States.
Secure .gov websites use HTTPS
A lock (
) or https:// means you've safely
connected to the .gov website. Share sensitive
information only on official, secure websites.
Heatmap indicating the enrichment of differently methylated transcripts between pig breeds in various canonical pathways; intensity of color indicates significance from light to dark