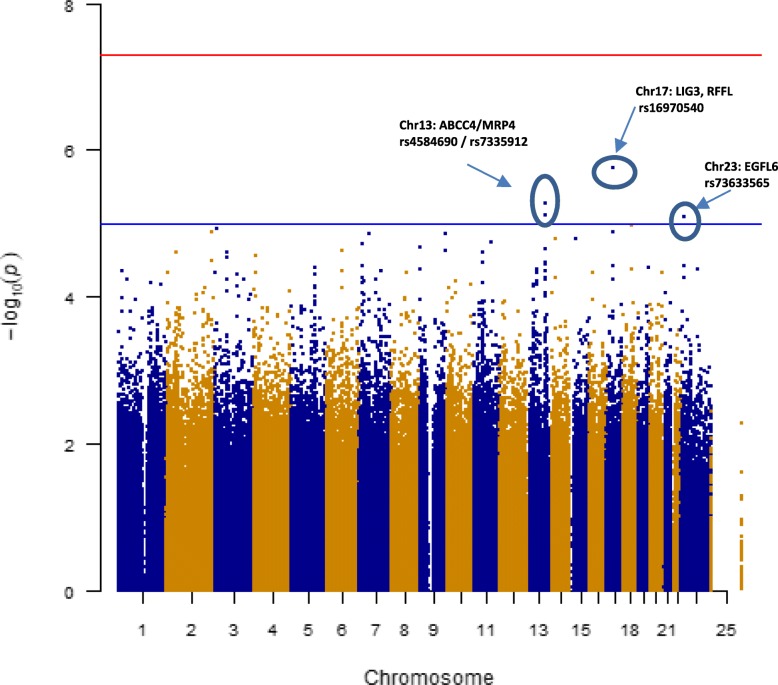
Fig. 1.
Manhattan plot for post-RT pain among breast cancer patients. This figure shows the p values of the SNPs after applying the additive genetic model in the multivariable logistic regression model by genomic location. No region exceeded genome-wide significance in the sample. Red line indicates genome-wide significance level of 5 × 10⁻⁸ and blue line indicates suggestive level of significance of 1 × 10⁻⁵

