Fig. 2.
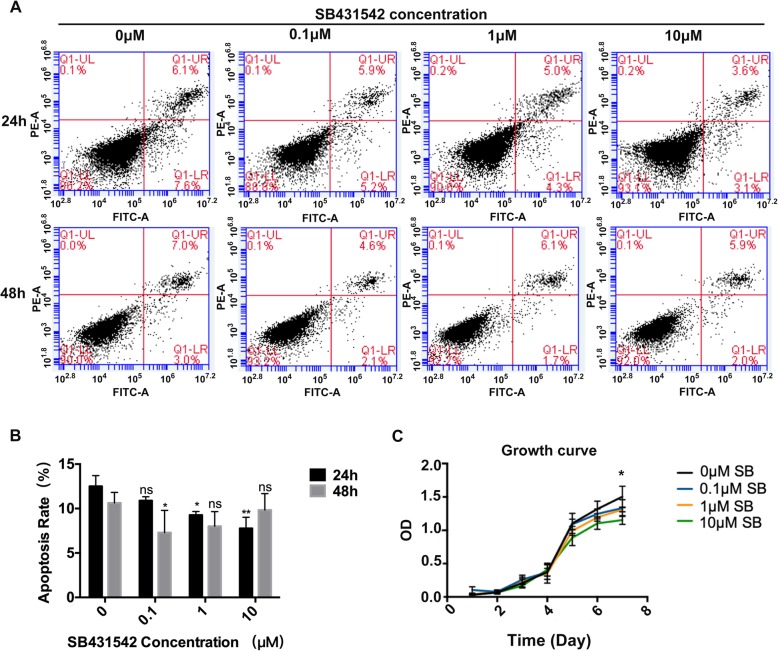
Effects of SB431542 on Growing status of hGMSCs. a and b Concentration-dependent apoptosis assay of hGMSCs with different concentration of SB4315342(0, 0.1, 1, and10μM) cultured for 24 h or 48 h. n = 3. c Cell growth curve of hGMSCs with different concentrations of SB4315342 (0, 0.1, 1, and10μM) by cell growth assay. Cell growth assay showed that the growth of group with 10 μM SB431542 was worse than the other groups at day7. n = 4. The results represent mean ± SD, ns, no statistically significant difference, p > 0.05, *p < 0.05, **p < 0.01, vs. 0 μM, one-way ANOVA with Tukey’s multiple comparison test

