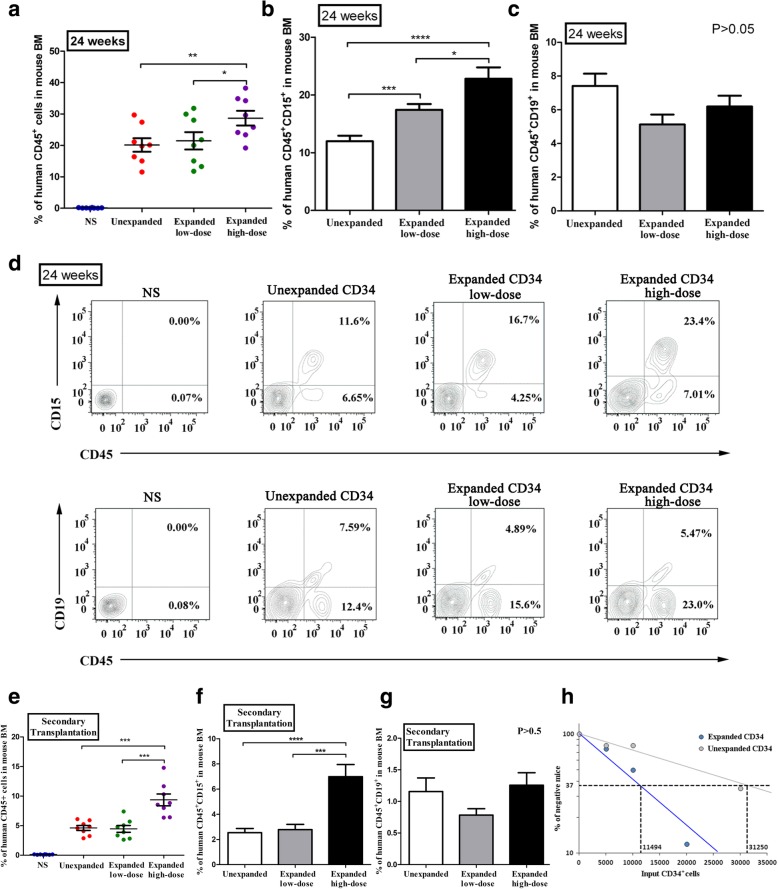
Fig. 4.
Long-term engraftment of human cells in NOD/SCID mice. a Extent of human cell engraftment in the BM of NOD/SCID mice transplanted with normal saline (NS; blue dots), unexpanded HSCs (red dots), low-dose expanded HSCs (green dots), and high-dose expanded HSCs (purple dots) at 24 weeks post-transplantation. b, c Proportion of CD45+CD15+ and CD45+CD19+ cells in the three HSC transplantation groups at week 24 post-transplantation. d Representative flow cytometry of human CD45+CD15+ (myeloid) lineage and CD45+CD19+ (lymphoid) lineage in mouse BM at 24 weeks post-transplantation. e Extent of human cell engraftment in mouse BM at 8 weeks following secondary transplantation in NOD/SCID mice. Data points are color-coded for each group as a. f, g Proportion of CD45+CD15+ and CD45+CD19+ cells in the three HSC transplantation groups at week 8 after secondary transplantation. Data are shown as mean ± SD, n = 8 in each group. * p < 0.05, **p < 0.01, ***p < 0.001, ****p < 0.0001; one-way ANOVA followed by Dunnett’s multiple comparison test. h Comparison of the frequency of SRC in unexpanded CD34+ cells and HEM-expanded CD34+ cells. The human CD45+ cell proportion in the mouse BMs was analyzed by flow cytometry 8 weeks after transplantation

