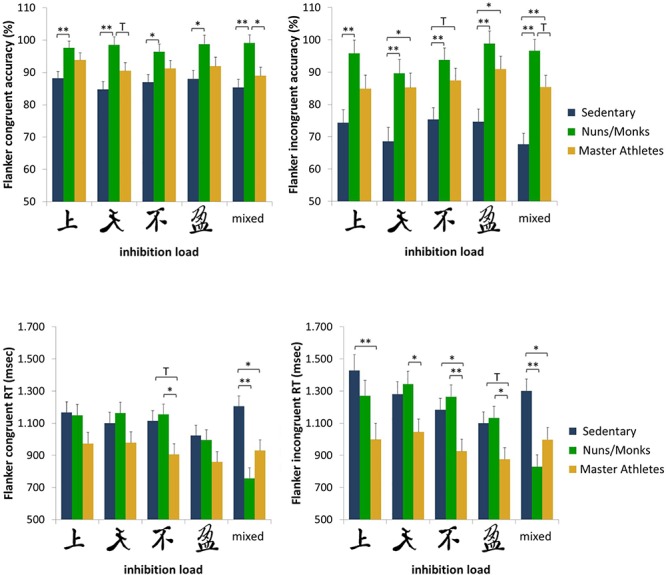
Figure 3.

Accuracy rates and reaction times for congruent and incongruent trials as a function of inhibition load and group (sedentary older adults, monks and nuns, master athletes). Bar graphs show sex adjusted mean ± SEM; ∗p < 0.05, ∗∗p < 0.01, and T p < 0.10.
