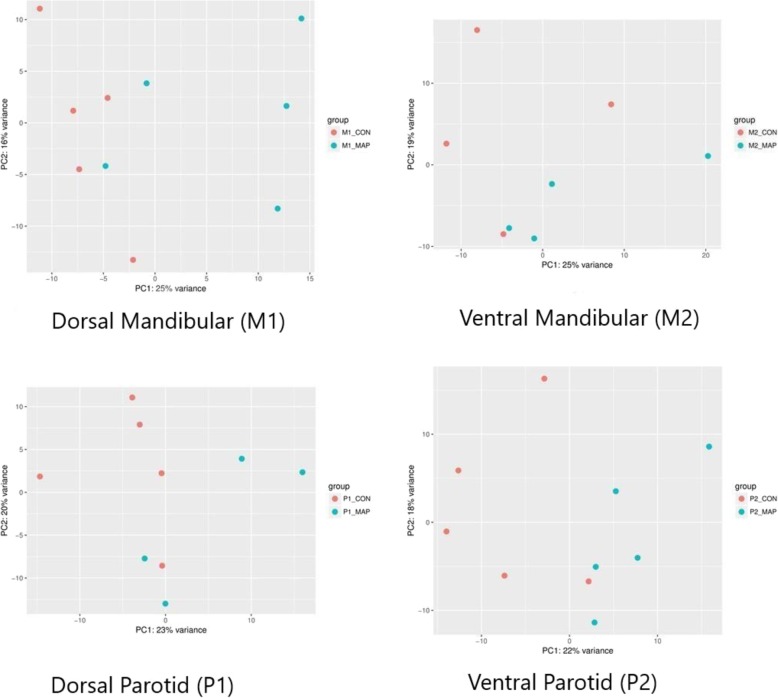
Fig. 1.
Principal Component Analysis (PCA) plot of the DEG dataset in Dorsal mandibular salivary gland extremity (M1); Ventral mandibular salivary gland extremity (M2); Dorsal parotid salivary gland extremity (P1) and Ventral parotid salivary gland extremity (P2) from control and MAP exposed cattle. The control (red) and MAP exposed (blue) samples are plotted along the first two principal component axes (PC1 and PC2)

