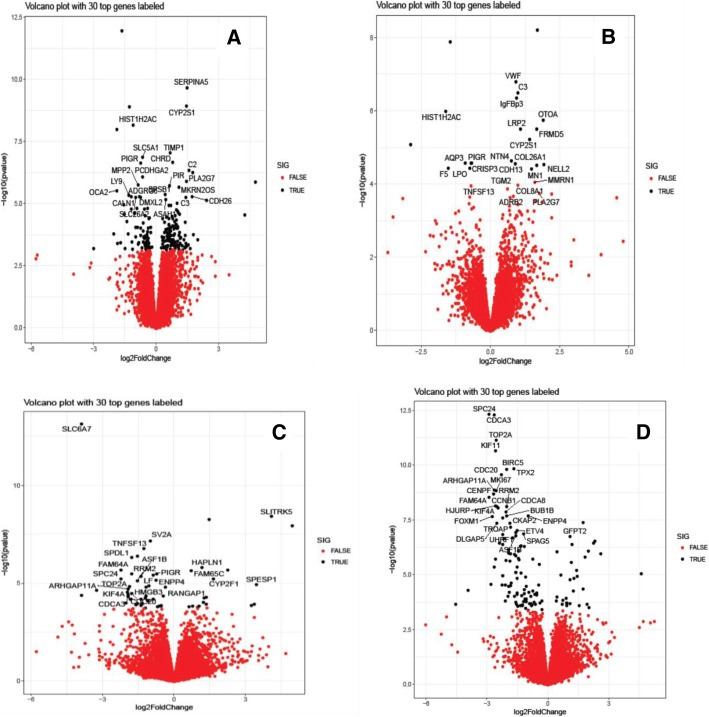
Fig. 4.
Volcano plot of differential expression (−log10 p-value vs log2fold change) in dorsal mandibular salivary gland (M1) (a), ventral mandibular salivary gland extremity (M2) (b), dorsal parotid salivary gland (P1) (c) and ventral parotid salivary gland extremity (P2) (d), respectively. Genes with an FDR < 0.05 are highlighted in black with top 30 of them labeled by their names

