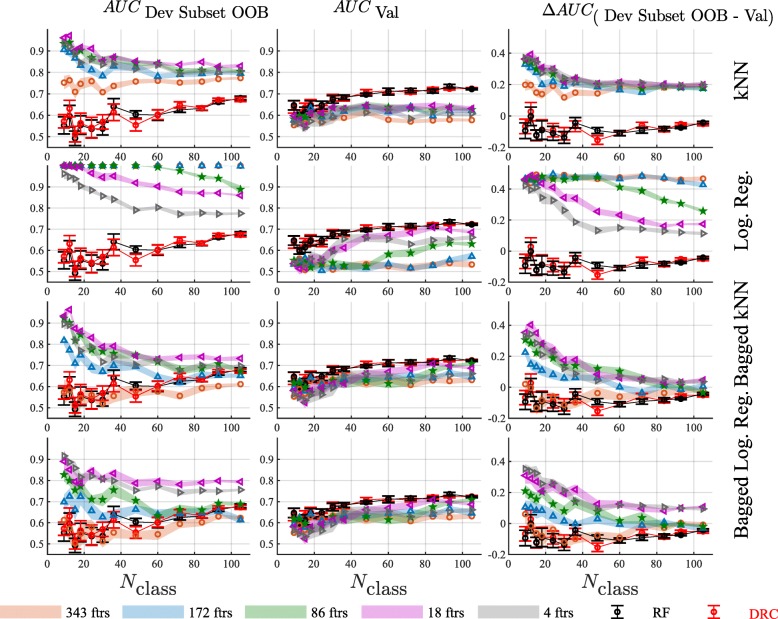
Fig. 3.
Results are shown for a single kNN classifier (1st row), a single logistic regression classifier (2nd row), bagged kNN classifiers (3rd row), and bagged logistic regression classifiers (4th row) as a function of the development subset size, for all 343 features, and 172, 86, 18, and 4 features, as selected by t-test p-value on the development subset. Left panels show average AUC on the development subset, center panels show average AUC on the validation set and right panels show the difference in AUC between the development subset and the validation set. Results for classifiers made with DRC and RF are also shown in each figure for comparison. Development subset AUCs are assessed within subset by out-of-bag estimates. Error bars show the standard error of the averages for DRC and RF and the colored bands show the standard error of the averages for the alternative classification methods

