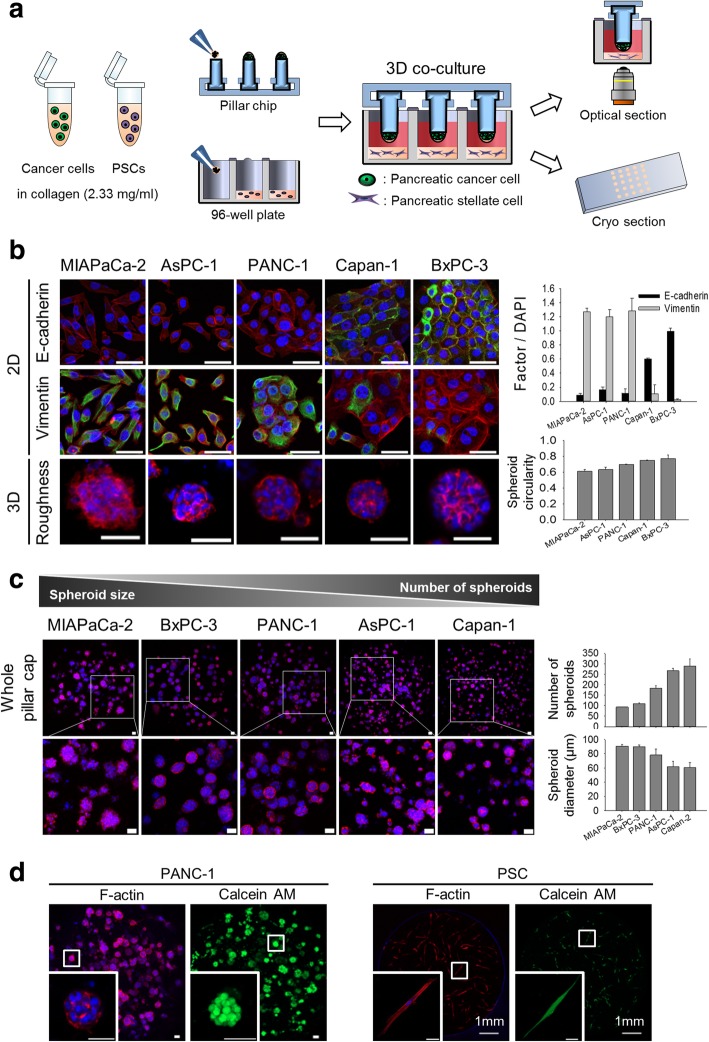
Fig. 1.
Optimization of co-culture conditions for TSs and PSCs. a A schematic illustration of cancer cells-PSCs co-culture using minipillar chips and 96-well plates and subsequent confocal microscopy following immunofluorescence staining. b The relationship between EMT status (levels of E-cadherin and vimentin expression; green) and spheroid surface roughness among five pancreatic cancer cell lines. c Comparison of the number and size of spheroids among five pancreatic cancer cell lines. d Morphology and viability (calcein AM) of TSs and PSCs when co-cultured. Cells were grown in the absence (b and c) and presence (d) of PSCs for 6 days. Staining of whole TSs and PSCs was carried out during cultivation in the well plates, and optical sections were acquired at 2 μm (b), 10 μm (c) and 5 μm (d) intervals and stacked into a z-projection. Data represent the mean ± SD of three independent experiments. Scale bars: 50 μm

