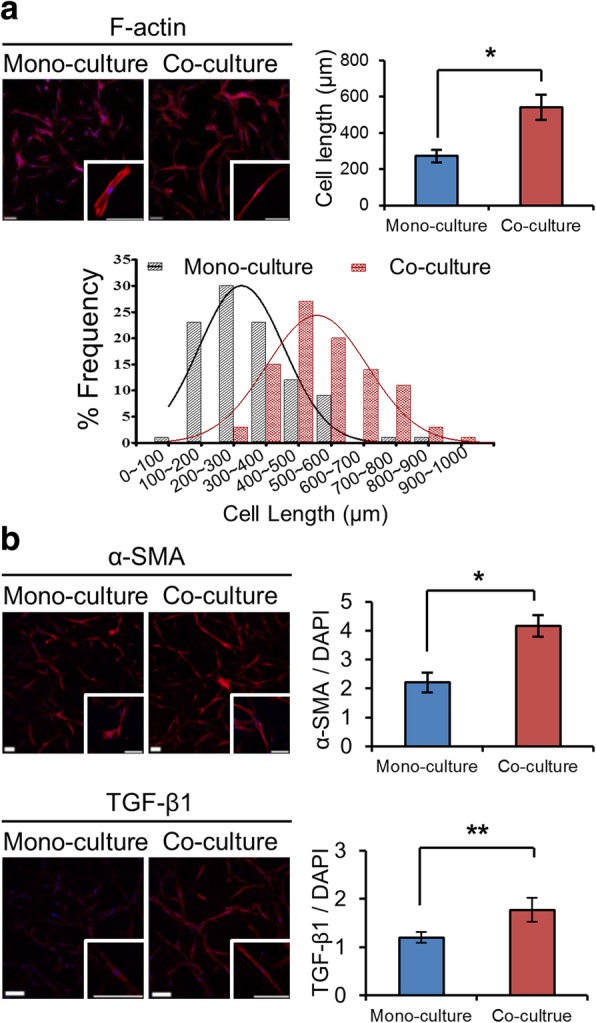
Fig. 2.

Activation of PSCs when co-cultured with PANC-1 spheroids. a Changes in the cell shape and length when co-cultured with PANC-1 spheroids. b The expression of α-SMA and TGF-β1 increased in PSCs co-cultured with TSs. Immunostaining was done after 7 day of culture in 96-well plates. Optical sections were acquired at 5 μm (a) and 1.5 μm (b) intervals and stacked into a z-projection. Data represent the mean ± SD of three independent experiments. Minimum of 50 cells were analyzed per field. Scale bars: 200 μm. * p < 0.05, **p < 0.01
