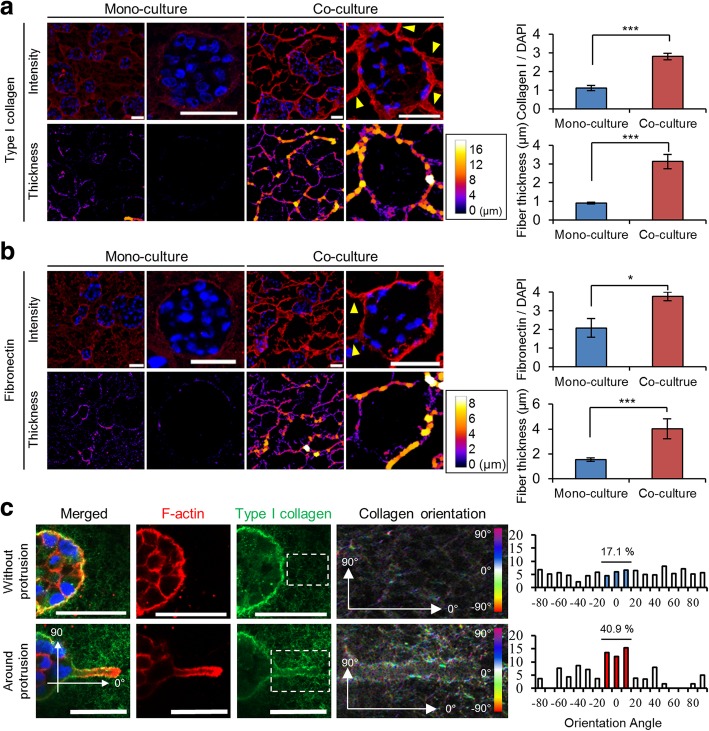
Fig. 3.
Changes in distribution and morphology of matrix protein fibers. The effects of PSC co-culture on the expression level and thickness of type I collagen (a) and fibronectin (b). Yellow arrowheads indicate the ECM bundle found in the periphery of TSs. c Difference angle distribution of collagen fibers between normal (non-invaded) matrix and matrix proximal to membrane protrusion (Invadopodia). After 7 days of culture, immunostaining was performed on cryo-sections of TSs (a and b) or on the whole TSs (c). Optical sections were acquired at 1 μm intervals and stacked into a z-projection. Data represent the mean ± SD of three independent experiments. Scale bars: 50 μm. * p < 0.05, ***p < 0.001

