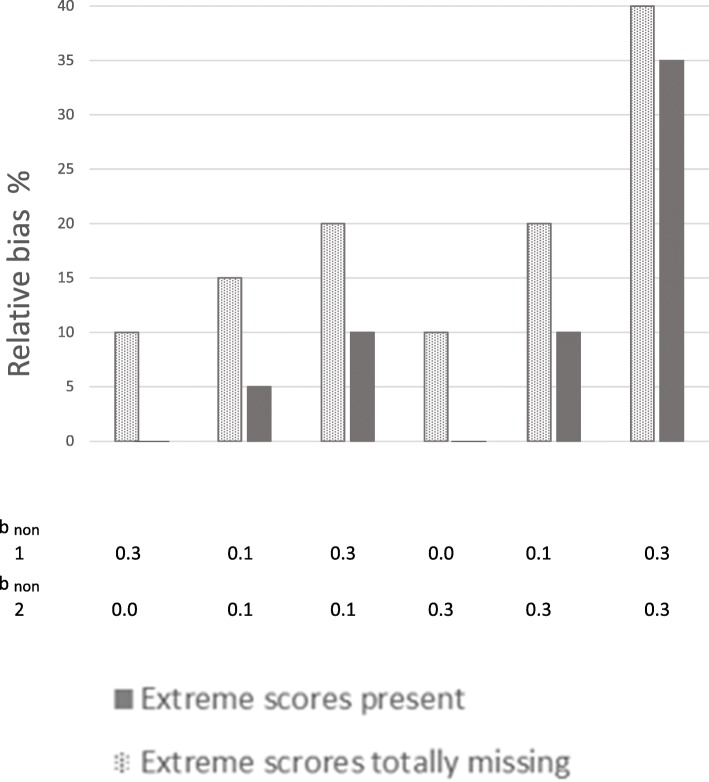
Fig. 9.
Relative bias in the association between × 1 and health outcome with 2 categories. Notes: Results are from situations with 50% response-rate. Solid bars represent situations where extreme scores are present even if they are under-represented in the samples. Dotted bars represent situations where the 10% most extreme scores on the health outcome are totally missing from the samples. Different degrees of dependency between studyvariables (× 1, × 2, × 3, and health outcome) and liability of non-response were modeled. bnon 1 is dependency of liability of non-response on predictors (× 1, × 2, and × 3). bnon 2 is dependency of liability of non-response on health outcome

