Fig. 6.
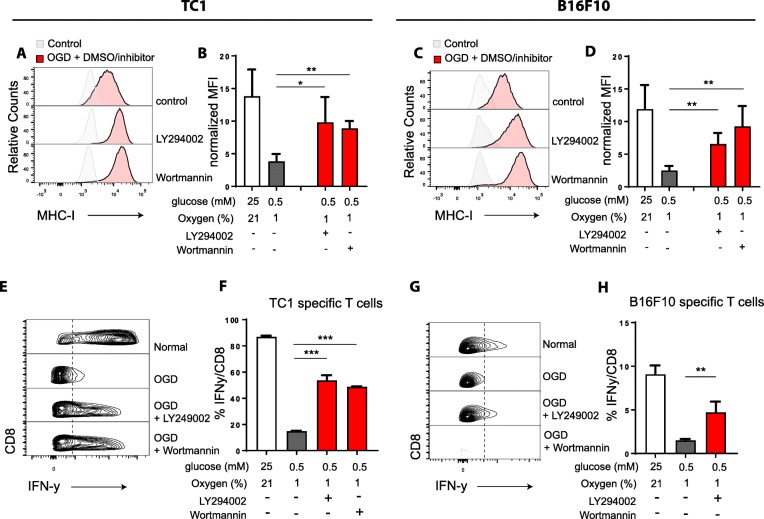
Improved tumor cell recognition by CD8 T cells after PI3K inhibition. Tumor cells were cultured under several nutrient limiting conditions stimulated with IFNy for 24 h with or without LY294002 or Wortmannin using DMSO as a control. a and c Histogram plot of MHC-I expression of TC1 (a) or B16F10 (c) tumor cells measured by flow cytometry. Representative data of three experiments is shown. b and d Quantified data of (a and c), shown as normalized MFI. e and g Density plots of IFNy production of TC1 (e) or B16F10 (g) specific T cells upon tumor cell recognition measured by flow cytometry. f and h Quantified data of (e and g). Representative data is shown as mean + − SD (n = 3). Unpaired t test was used to calculate significance; n.s., not significant *, p < 0.05, **, p < 0.01, ***, p < 0.001

