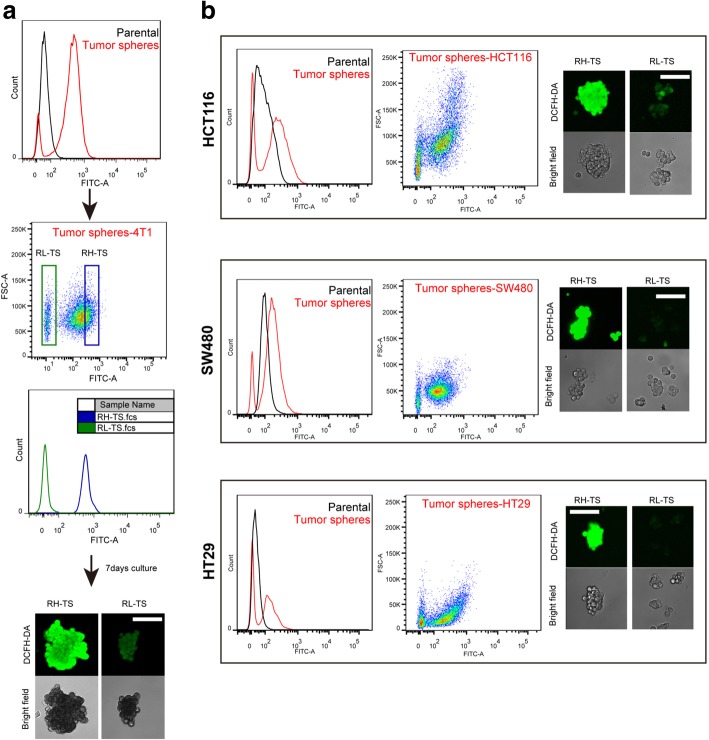
Fig. 2.
Isolation of RH-TS and RL-TS cells. a RH-TS and RL-TS cells were isolated from 4 T1 tumor spheres by flow cytometry and intracellular ROS concentrations were measured by DCFH-DA staining. RH-TS and RL-TS cells were re-analyzed by FACS and confocal microscopy. b Tumor spheres were isolated from HCT116 cells, SW480 cells, and HT29 cells. ROS profile representing by DCFH-DA fluorescence was measured by FACS and confocal microscopy. Scale bars =100 μm

