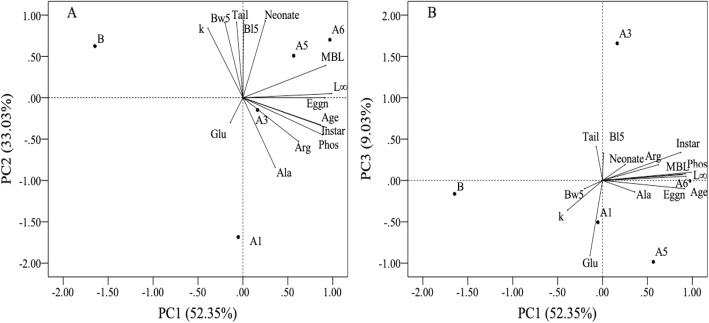
Fig. 1.
Results of PCA showing a biplot of PC scores of JPN1 genotypes (A1, A3, A5, A6 and B) and loadings of phenotypic traits (Glu: beta-glucosidase; Phos: alkaline phosphatase; Arg: arginine amino-peptidase; Ala: alanine amino-peptidase; Age: maturation age; Instar: maturation instar number; MBL: maturation body length; k: growth coefficient; Eggn: mean egg number of the first three clutches; Neonate: mean neonate size of the first three clutches; Bl5: body length at five days; Bw5: body weight at five days; Tail: relative tail-spine length of the first adult instar; L∞: asymptotic body length). Panels a and b represent biplots of the PC1 and PC2, and the PC1 and PC3, respectively

