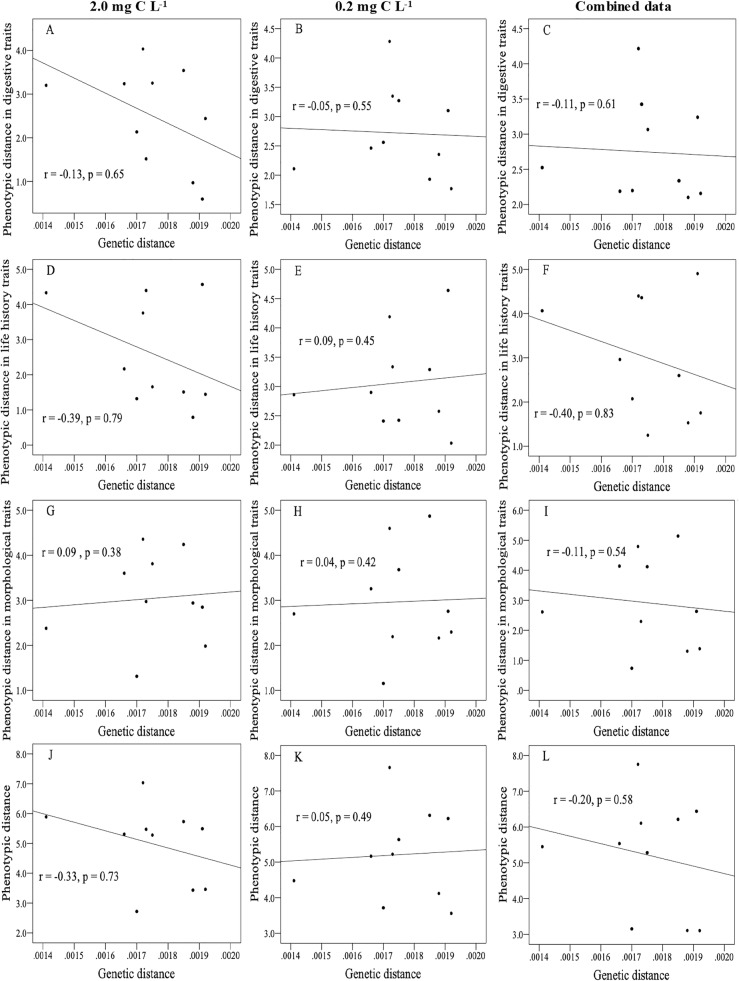
Fig. 2.
Relationship between genetic distance and phenotypic distance in different trait types between Daphnia pulex clones. Among these, a, d, g, and j showed the relations at the food concentrations of 2.0 mg C L− 1, b, e, h, and k showed the relations at the food concentrations of 0.2 mg C L− 1, and c, f, i, and l showed the relations in the combined data. The correlation coefficient (r) and probability of significance (p) in the Mantel test are shown in each panel

