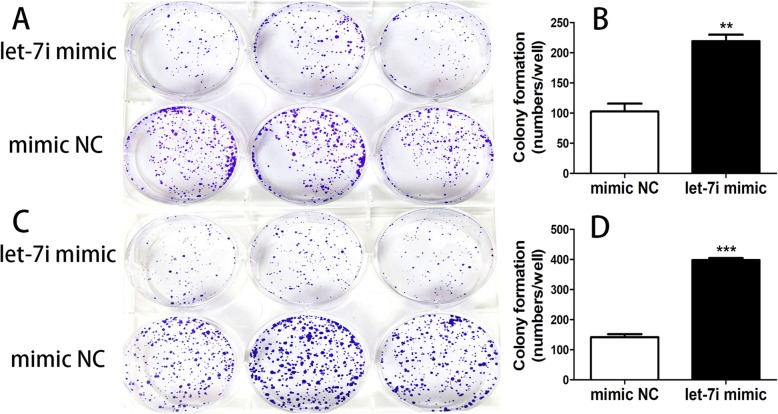
Fig. 3.
(a) The colonies of cell lines T24 transfected with let-7i mimic and negative control were stained by crystal violet at day 14 post-transfection. (b) The graph represents the mean of colony number ± SEM in cell lines T24 transfected with let-7i mimic and negative control. (c) The colonies of cell lines 5637 transfected with let-7i mimic and negative control were stained by crystal violet at day 14 post-transfection. (d) The graph represents the mean of colony number ± SEM in cell lines 5637 transfected with let-7i mimic and negative control. (**P < 0.01, ***P < 0.001)

