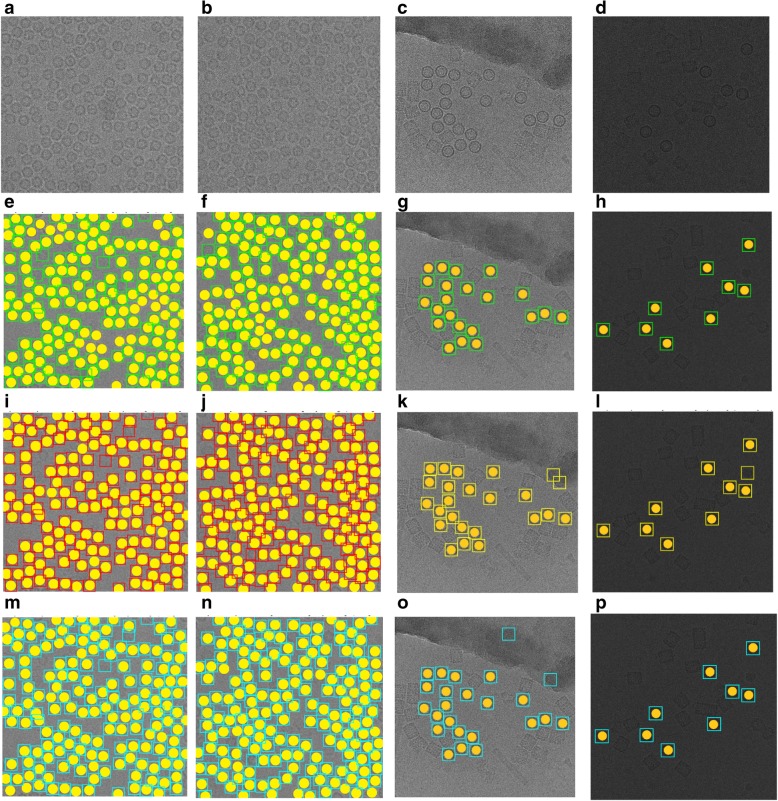
Fig. 16.
Automated particle picking results on the two datasets. a A cryo-EM image with a high identical particle density and a lack low-frequency from the Apoferritin dataset. b A low SNR cryo-EM image from the Apoferritin dataset. c A micrograph image from the KLH dataset that includes excessively overlapped particles due to confounding artifacts such as ice contamination, degraded particles, and particle aggregates. d A micrograph image from the KLH dataset that has a very low spatial density and different intensity levels. e and (f) Particle picking results using Intensity Based Clustering Algorithm (ICB) (Apoferritin dataset). i and (j) Particle picking results using k-means (Apoferritin dataset). m and (n) Particle picking results using FCM (Apoferritin dataset). g and (h) Particle picking results using Intensity Based Clustering Algorithm (ICB) (KLH dataset). k and (l) Particle picking results using k-means (KLH dataset). o and (p) Particle picking results using FCM (KLH dataset)

