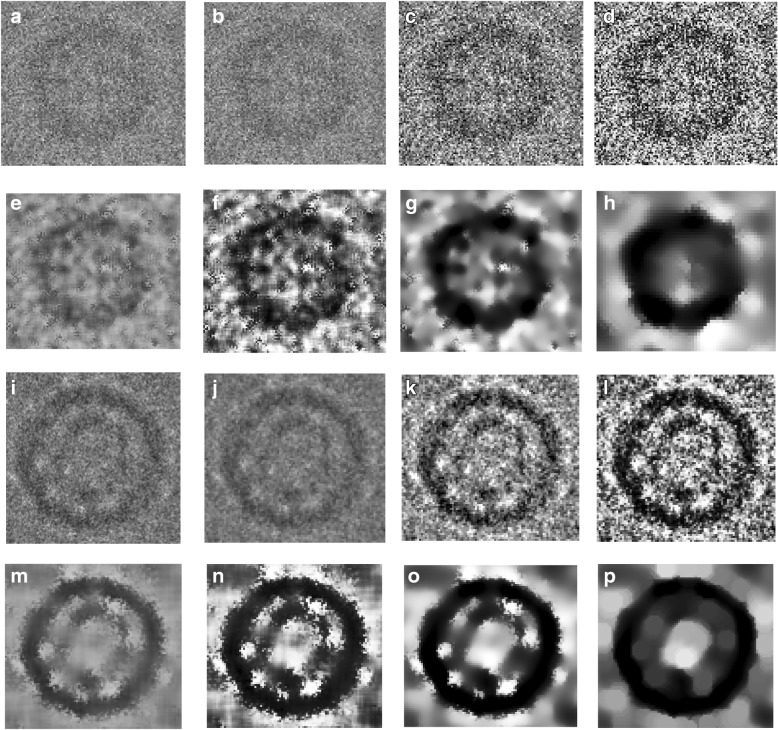
Fig. 5.
Illustration of effects of the cryo-EM image analysis on a zoom-in selected particle region using two different examples from two datasets. a An original zoom-in selected particle region in the micrograph image in Apoferritin dataset. b The normalized single particle image region. c The single particle region after applying the contrast enhancement correction (CEC). d The single particle region after applying the histogram equalization. e The single particle region after applying image resonation with Wiener filtering. f The single particle region after applying the contrast-limited adaptive histogram equalization. g The single particle region after applying image guided filtering. h The single particle region after applying morphological image operation. i An original zoom-in selected particle region in a micrograph image in the KLH dataset before the preprocessing steps. j The selected particle region in a micrograph image in the KLH dataset after normalization. k The selected particle region in a micrograph image in the KLH dataset after applying the contrast enhancement correction (CEC). l The selected particle region in a micrograph image in the KLH dataset after applying the histogram equalization. m The selected particle region in a micrograph image in the KLH dataset after applying image resonation with Wiener filtering. n The selected particle region in a micrograph image in the KLH dataset applying the contrast-limited adaptive histogram equalization. o The selected particle region in a micrograph image in the KLH dataset after applying image guided filtering. p The selected particle region in a micrograph image in the KLH dataset after applying morphological image operation

