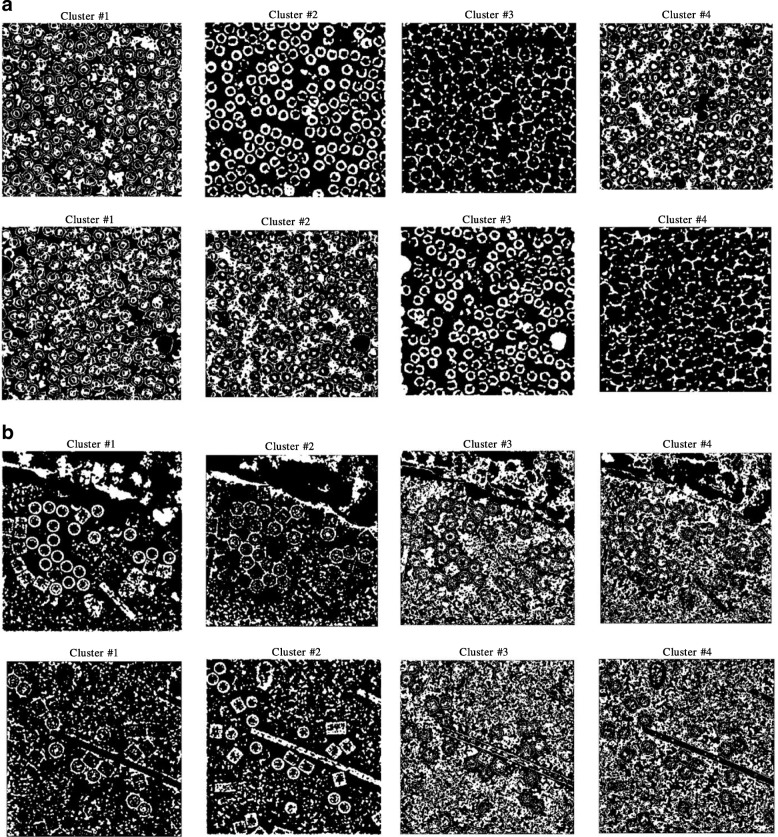
Fig. 7.
Different cryo-EM image clustering results using the k-means clustering algorithm. a The two sets of cryo-EM images clusters results (Cluster #1, Cluster #2, Cluster #3 and Cluster #4) on the Apoferritin dataset. Most real particles were assigned to Cluster 2 and Cluster 3, respectively. b The two sets of cryo-EM image clustering results (Cluster #1, Cluster #2, Cluster #3 and Cluster #4) on the KLH dataset. Most real particles were assigned Cluster 1 and Cluster 2, respectively

