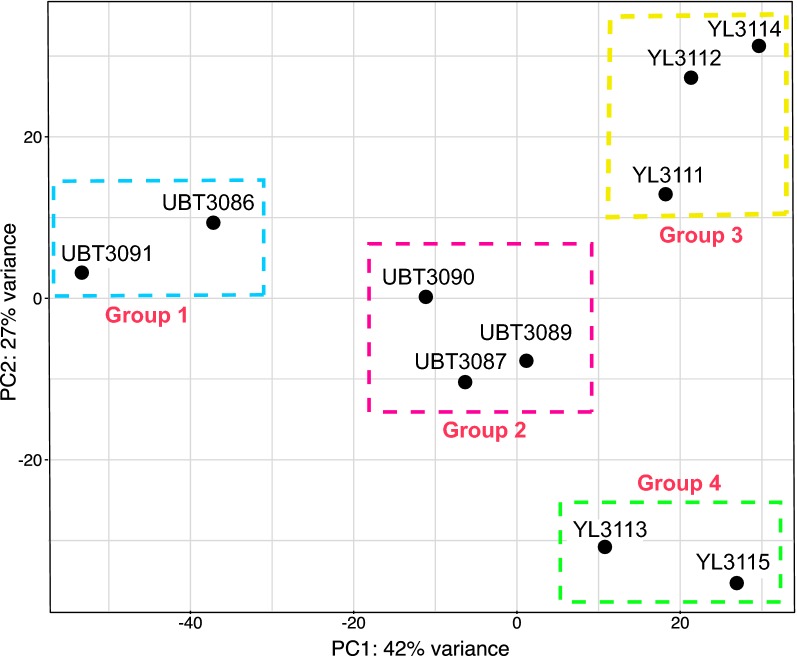
Fig. 1.
Principal component analysis (PCA) of genome-wide expression profiles for ten clinical isolates (5838 genes). The principal components were calculated from normalized read counts implemented in DESeq2. Axes represents the first and second principal components (PC1 and PC2), accounting for 42% and 27% of total variance, respectively. Each dot represents an individual isolate, and isolates were divided into four ‘patient groups’ based on the PCA

