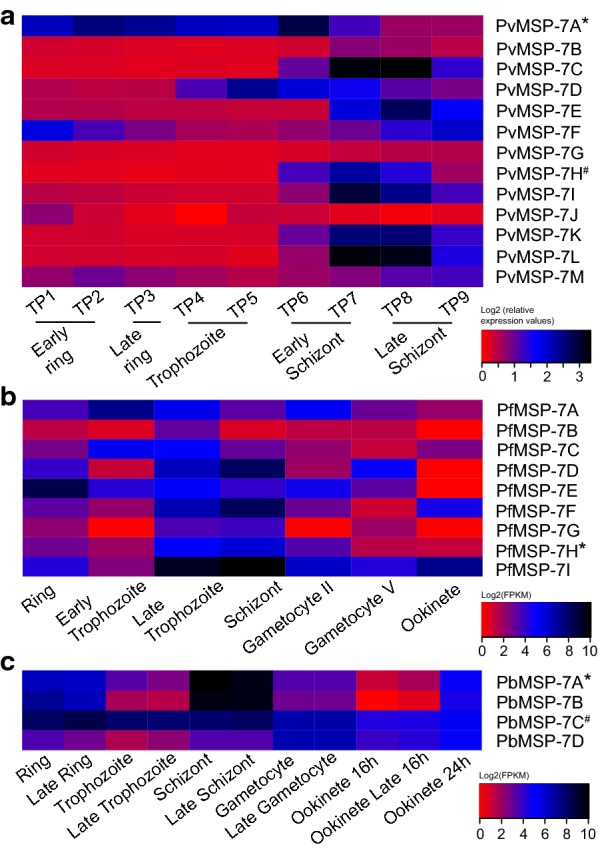
Fig. 7.

Comparison of MSP-7 expression profiles from published transcriptomes of synchronized cell cultures in multiple Plasmodium species. a Expression profiles for 12 PvMSP-7 genes in P. vivax, as determined by microarray analysis [25]. b Expression profiles for seven PfMSP-7 genes in P. falciparum across seven blood-stages, as determined by cDNA sequencing [56]. c Expression profiles for four PbMSP-7 genes in P. berghei, across five life stages, as determined by RNA-seq [57]. All values are log2-transformed. Shading represents transcript abundance from low (red) to high (black). An asterisk and hash indicate two sets of orthologous genes in different species respectively
