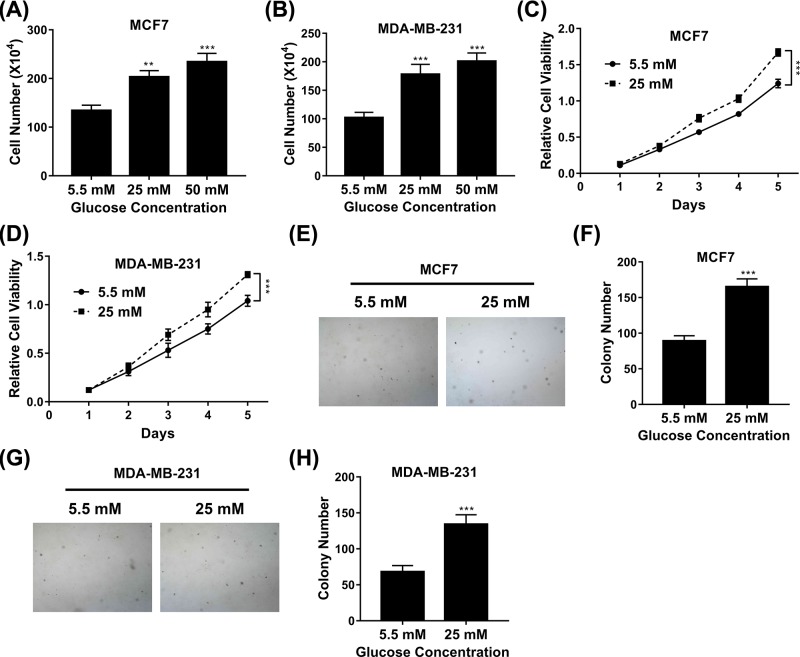
Figure 1. Influence of high glucose on cell proliferation.
(A,B) Proliferation of MCF7 (A) and MDA-MB-231 (B) cells exposed to medium with glucose concentrations varying from 5.5 to 50 mM was determined by cell counting assay. (C,D) Proliferation of MCF7 (C) and MDA-MB-231 (D) cells exposed to medium with glucose concentrations of 5.5 or 25 mM was determined by MTT assay. (E,F) Proliferation of MCF7 cells exposed to medium with glucose concentrations of 5.5 or 25 mM was determined by soft agar assay. (G,H) Proliferation of MDA-MB-231 cells exposed to medium with glucose concentrations of 5.5 or 25 mM was determined by soft agar assay. Data are shown as mean ± S.D. **P<0.01; ***P<0.001; (ANOVA test in figures C and D, others Student’s t-test).

