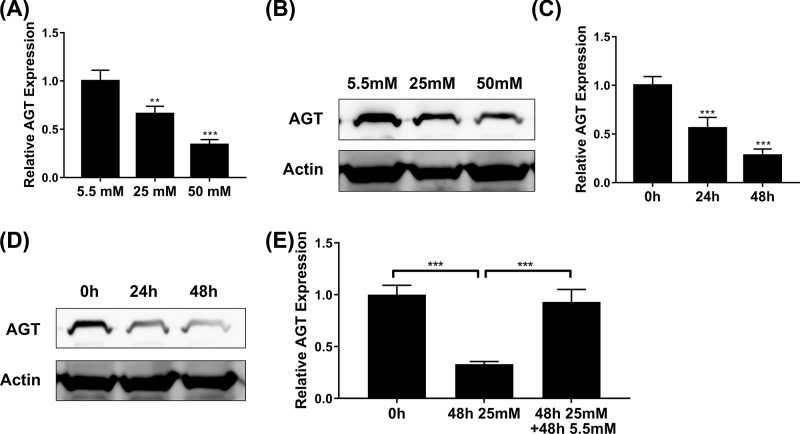
Figure 3. High glucose inhibits AGT expression.
(A,B) The expression of AGT in MCF7 cells exposed to medium with glucose concentrations of 5.5, 25, or 50 mM was determined by qPCR (A) and Western blot (B). (C,D) The expression of AGT in MCF7 cells exposed to medium with glucose concentrations 25 mM for 24 or 48 h was determined by qPCR (C) and Western blot (D). (E) The expression of AGT in MCF7 cells exposed to medium with glucose concentrations 25 mM for 48 h and then removed with 5.5 mM for 48 h was determined by qPCR. Data are shown as mean ± S.D. **P<0.01; ***P<0.001; (ANOVA).

