Figure 5.
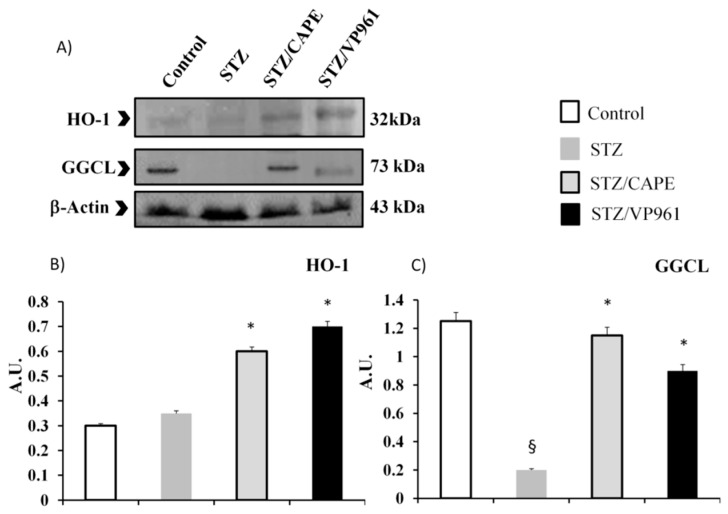
Representative Western blotting of HO-1 and GGCL protein expressions (Panel A). Densitometric quantification of HO-1 and GGCL protein expressions in the pancreas of non-STZ rats (control), STZ rats, and CAPE- or VP961-treated STZ rats (CAPE/STZ; VP961/STZ) (Panel B,C). Values are mean ± standard deviation (S.D.) of three independent experiments performed in triplicate. * p < 0.05 vs. diabetic control rats (STZ); § p < 0.05 vs. normal control rats.

