Figure 1.
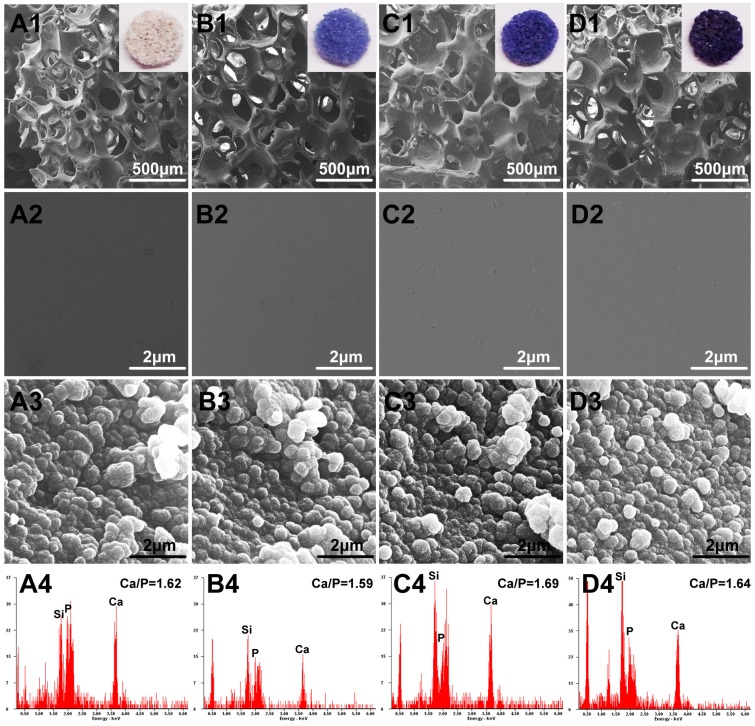
Optical images and FESEM images for the BG (A1, A2), 0.5Co-BG (B1, B2), 1Co-BG (C1, C2) and 3Co-BG (D1, D2) scaffolds before soaking in SBF; SEM images for the BG (A3), 0.5Co-BG (B3), 1Co-BG (C3) and 3Co-BG (D3) scaffolds after soaking in SBF for 90 days; EDS analysis for the BG (A4), 0.5Co-BG (B4), 1Co-BG (C4) and 3Co-BG (D4) scaffolds after soaking in SBF for 90 days. Magnification: ×100 for A1, B1, C1, D1; ×40,000 for A3, B3, C3 and D3, A4, B4, C4 and D4.

