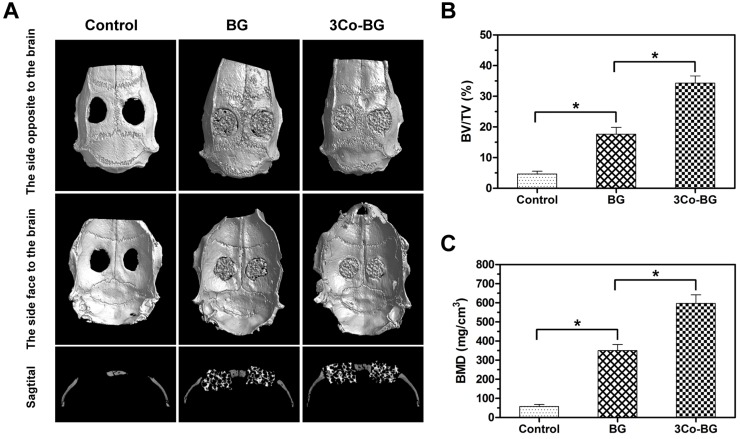
Figure 8.
Micro-CT evaluation of bone regeneration in the rat calvarial defects implanted with the BG and the 3Co-BG scaffolds and in the unfilled defect (control) at 8 weeks post-implantation. (A) Top, bottom and cross-sectional views of reconstructed images; (B, C) Bone mineral density (BMD) and bone volume/total volume (BV/TV) in the defects implanted with the scaffolds and in the unfilled defects. Mean SD; n =3. *Significant difference between groups (p<0.05).

