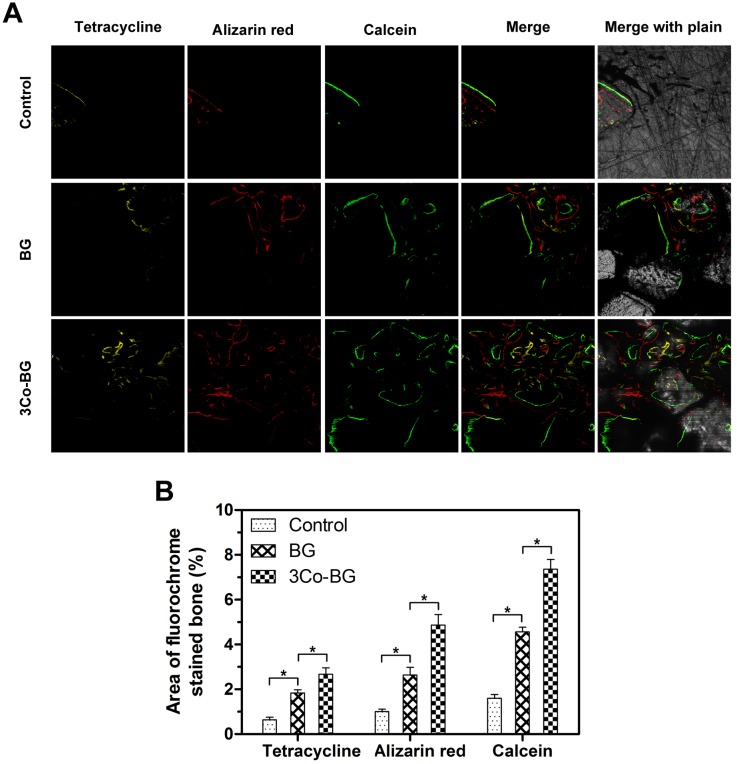
Figure 9.
New bone formation and mineralization, determined histomorphometrically by fluorochrome-labeling analysis, in rat calvarial defects implanted with the BG and the 3Co-BG scaffolds and in the unfilled defects (control). (A) Column 1 (yellow) shows tetracycline at week 2; column 2 (red) shows alizarin red at week 4; column 3 (green) shows calcein at week 6; column 4 represents merged images of the three fluorochromes for the same group, and column 5 represents merged images from a plain microscope. (B) The percent fluorochrome area in the defects implanted with the scaffolds and the unfilled defects. Mean SD; n =3. *Significant difference between groups (p<0.05).

