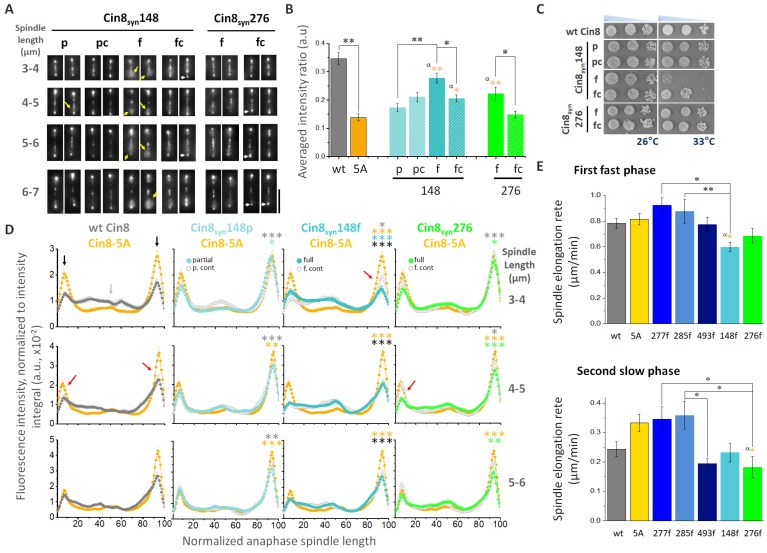
Figure 4.
Synthetic Cin8 variants can confer novel phosphoregulation. (A) Spindle localization of 3GFP-tagged Cin8syn phospho-variants at various spindle lengths (indicated on the left). Mother cell is oriented to the bottom of micrographs. Yellow arrows: Cin8 detachment from the spindle; white arrows: Cin8 concentration at the SPBs. Scale bar: 5 µm. (B) Cin8 detachment from 6-7 µm spindles, measured as in Figs. 2D and E. Average ± s.e.m. of 18-20 cells. p: partial Cdk1 consensus sequence [S/T-P], pc: control of partial consensus sequence [A-P], f: full Cdk1 consensus sequence [S/T-P-x-K/R], fc: control of full consensus sequence [A-P-x-K/R]. α: p-value of t-test compared to Cin8-5A. *p < 0.05, **p < 0.01. (C) Viability of shuffle cin8Δ;kip1Δ;cyhr strains expressing Cin8syn mutants. Cells were plated in serial dilution and grown on YPD plates with 7.5 µg/ml cyclohexamide at 26°C and 33°C. (D) Average fluorescence intensity along the spindle of Cin8syn mutants, indicated on top, compared to the fluorescence distribution of the corresponding non-phosphorylatable alanine control mutant and of Cin8-5A as in Fig. 2C. Color coding of the mutants and their control is indicated. Black arrows: Cin8 accumulation at the SPBs; light gray arrow: elevated distribution of Cin8 at the midzone; red arrows: reduced distribution at the SPBs compared to Cin8-5A. At each spindle length, the average intensity ratio in arbitrary units ± s.e.m. of 15-20 cells is presented. Significance was determined for Cin8syn148p, Cin8syn148f and Cin8syn276f compared to wt Cin8 (gray asterisks), Cin8-5A (orange asterisks), the respective control variant on the same plot (light cyan, cyan and green for Cin8syn148p, Cin8syn148f and Cin8syn276f respectively) and between Cin8syn148p and Cin8syn148f (black asterisks). *p < 0.05, **p < 0.005, ***p < 0.0005. (E) Spindle elongation rates of the first-fast and the second-slow phases of the full native and synthetic variants. Averages ± s.e.m. of 9-12 cells are shown. Phospho-variants are indicated on the bottom, 5A: Cin8-5A. α (orange): p-value compared to Cin8-5A. *p < 0.05, **p < 0.01.

