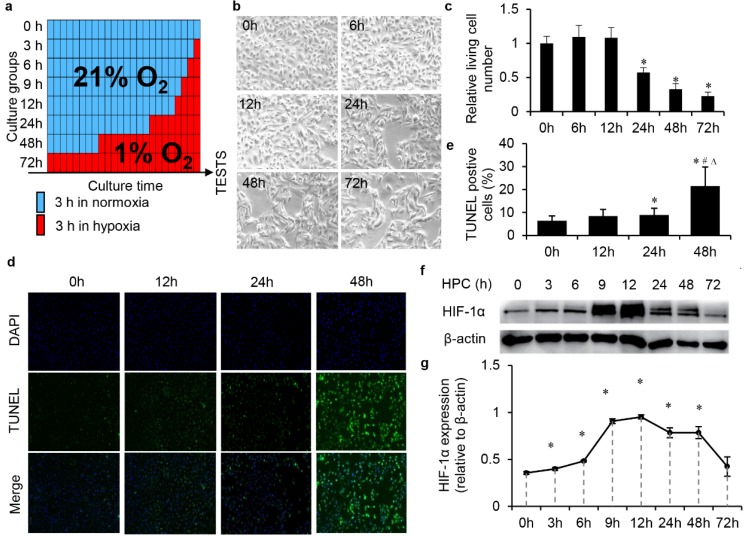
Figure 1.
Optimal condition screening for simulating IPC in vitro with HK2 cells under the 1% oxygen culture circumstance. (a) Schema of the protocols of screening for optimal conditions of simulating IPC in vitro with HK2 cells. (b) Morphology and amount changes of cells under the hypoxic environment, magnification 200×. (c) The relative living cell numbers in each group, (* P<0.05 compare with 0 h). (d) Cell TUNEL assay and (e) the quantification (*, #, ∆, P<0.05 compare with 0 h, 12 h, 24 h, respectively). (f) HIF-1α was tested by western blot and (g) semi-quantification (* P<0.05 compare with 0 h).

