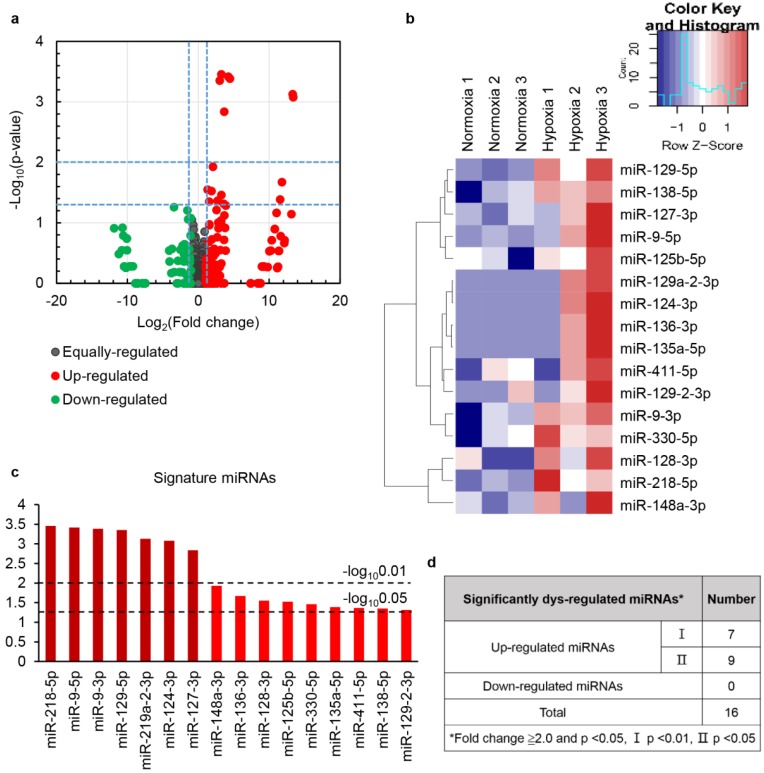
Figure 5.
HPC modulated the expression of a subset of miRNAs in EVs. Differentially expressed miRNAs were analysed by hierarchical clustering of log2 value. Fold change enal ischaemia reperfusion injected with PBS (IR+PBS), with EVs from HK2 cells culturedt (a) for differential gene expression, red and green colours indicate up- or downregulated miRNAs, respectively. The clustered heat map (b), profile (c) and number (d) of the differentially expressed miRNAs are shown.

