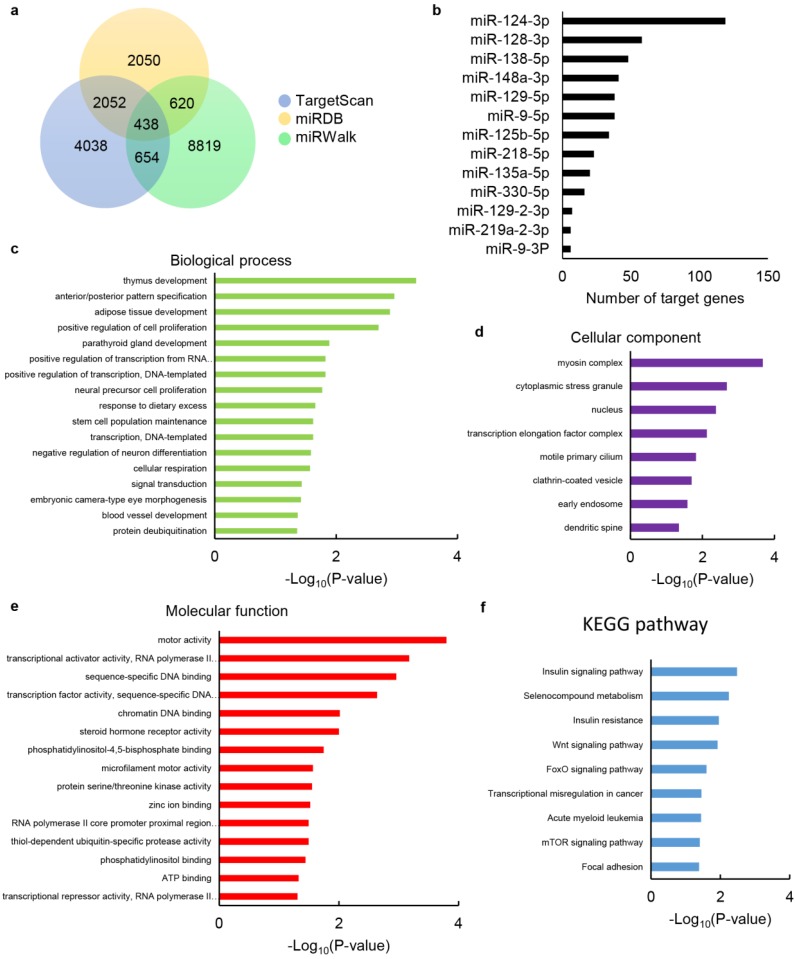
Figure 6.
Target gene prediction of differentially expressed miRNAs and bioinformatics analysis of target genes. (a) Venn diagram showing the overlap of candidate target genes. (b) Bar charts showing the number of target genes for dysregulated miRNAs. The chart fragments represent the number of target genes associated with each term. (c) Biological process, (d) cellular components and (e) molecular function assessed by GO analysis. (f) KEGG pathway enrichment analyses for target genes. The terms are listed on the Y-axis, while the P-values are listed on the X-axis.

