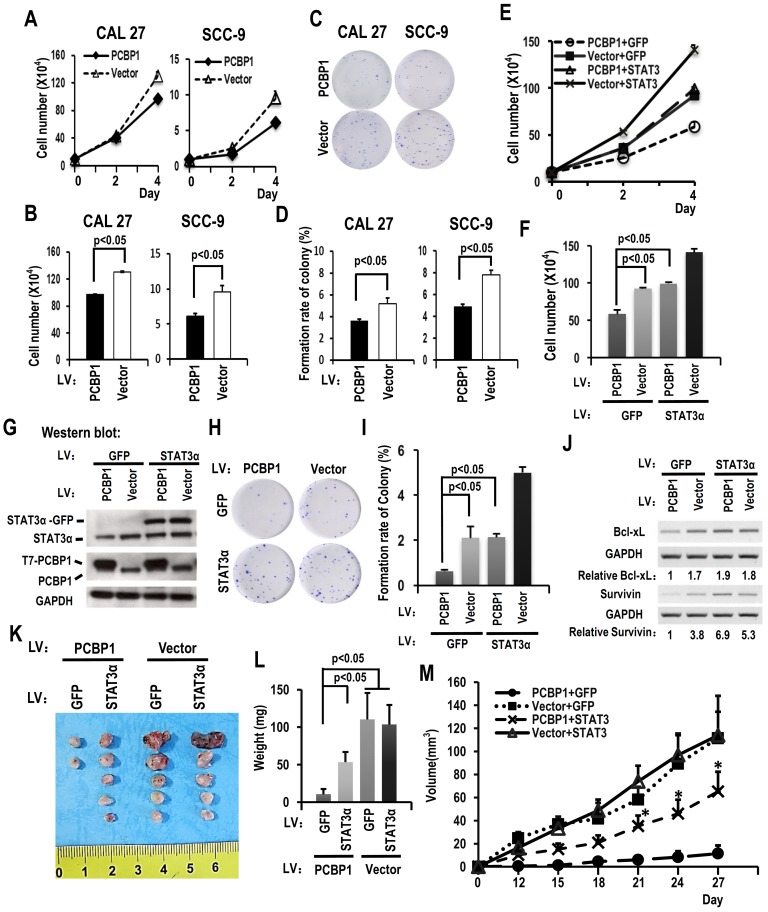
Figure 3.
Downregulating the ratio of STAT3 α/β inhibits the cell growth of OSCC cell through overexpression of PCBP1. (A) CAL 27 or SCC-9 cells with T7-PCBP1 stable overexpression were seeded into 12 well plates on Day 0. Cell numbers were counted on Day 2 and Day 4. (B) The histograms show apparent statistically significant difference between the PCBP1 overexpression and control groups on Day 4. Data are the means ± SE, n=3. (C, D) Effects of PCBP1 overexpression on the clonogenic ability of CAL 27 and SCC-9 cells. One thousand cells were seeded in 6 cm dishes and cultured for 10 days. Representative images are shown (C). (D) The histograms summarized the number of colonies. Data are the means ± SE, n =3. (E) Overexpression of STAT3α rescued cell growth inhibition induced by PCBP1 overexpression. CAL 27 cells were transfected with T7-PCBP1 expression lentivirus, STAT3α-GFP expression lentivirus, empty control lentivirus and/or GFP expression control lentivirus. Transfected cells were divided into four groups: T7-PCBP1 + GFP, Vector + GFP, T7-PCBP1 + STAT3, and Vector + STAT3. Cell number was counted at Day 2 and Day 4. (F) The histograms summarized the numbers of cells counted on Day 4. Data are the means ± SE, n =3. LV: lentivirus. (G) Western blot displayed the overexpression of exogenous T7 tagged PCBP1 and exogenous STAT3α-GFP fusion protein. GAPDH served as a loading control. (H-I) STAT3α overexpression rescues the inhibition of PCBP1 overexpression on the clonogenic ability of CAL 27 cells. One thousand cells were seeded into 6 cm dishes and cultured for 10 days. Representative images are shown (H). (I) The histograms summarized the numbers of colonies. Data are the means ± SE, n =3. (J) Expression levels of the indicated STAT3 target genes (Bcl-xl and survivin) were analyzed by RT-PCR. GAPDH served as a loading control. (K-M) STAT3α overexpression rescues the inhibition of PCBP1 overexpression on the tumorigenesis of CAL 27 cells. Transfected CAL 27 cells in panel (G) was inoculated into nude mice (5 × 10⁵ cells per mice). (K-L) Tumors were dissected out and weighed on day 27. (M) Growth curves of tumors in nude mice (n = 5 mice in each group). Data are presented as mean ± SE. *P < 0.05 compared with PCBP1 + GFP group.

