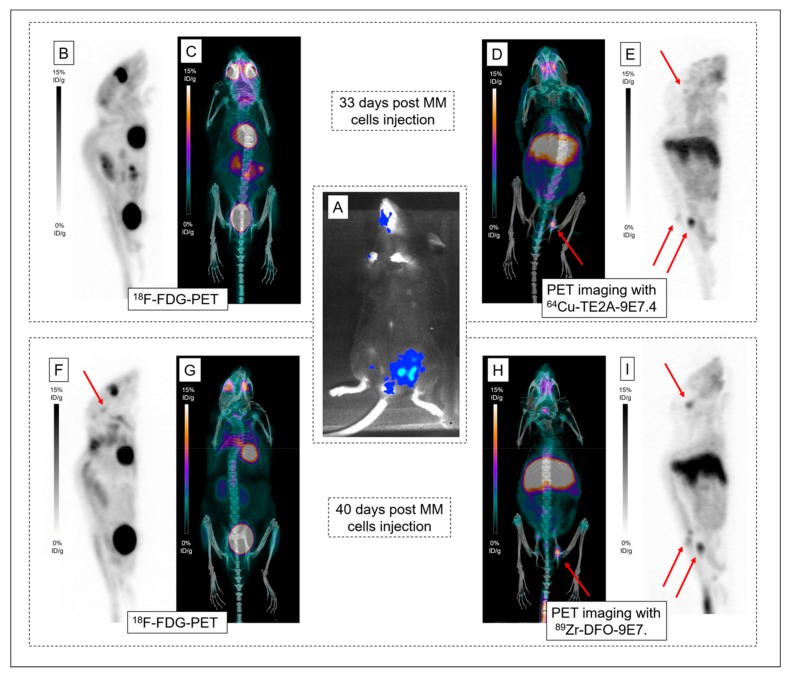
Figure 7.
PET imaging with 64Cu-TE2A-9E7.4 and 89Zr-DFO-9E7.4. Bioluminescence imaging (A) revealing lesions in the spine and the left iliac wing. Maximum intensity projections of 18F-FDG-PET and CT (B;C) and maximum intensity projections of PET and CT imaging with 64Cu-TE2A-9E7.4 at 24 h post-injection (PI) (D;E), realized 33 days post multiple myeloma (MM) cells injection in Mouse 18. Maximum intensity projections of 18F-FDG-PET and CT (F;G) and maximum intensity projections of PET and CT imaging with 89Zr-DFO-9E7.4 at 24 h (PI) (H;I), realized 40 days post MM cells injection. Pathological uptakes were spotted by red arrows in the skull, spine and the left iliac wing.

