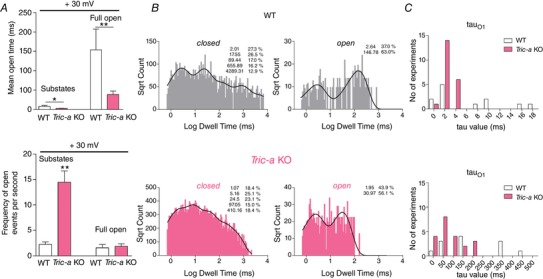
Figure 3. Lifetime analysis of the SR K+‐channels from WT and Tric‐a KO mouse skeletal muscle.

A, mean open time for the subconductance open states and the full open state at +30 mV (top) and frequency of openings to subconductance states and to the full open state at +30 mV (bottom). B, open and closed lifetime distributions and probability density functions for a representative SR K+‐channel from WT and from Tric‐a KO. The corresponding time constants (taus) and percentage areas are shown. C, frequency histogram distributions of the two open lifetime constants: tauO1 and tauO2. WT data are shown in white and Tric‐a KO in pink. The mean ± SEM (* P < 0.05, ** P < 0.01) is shown where n = 12 (WT) or 21 (Tric‐a KO). [Color figure can be viewed at wileyonlinelibrary.com]
