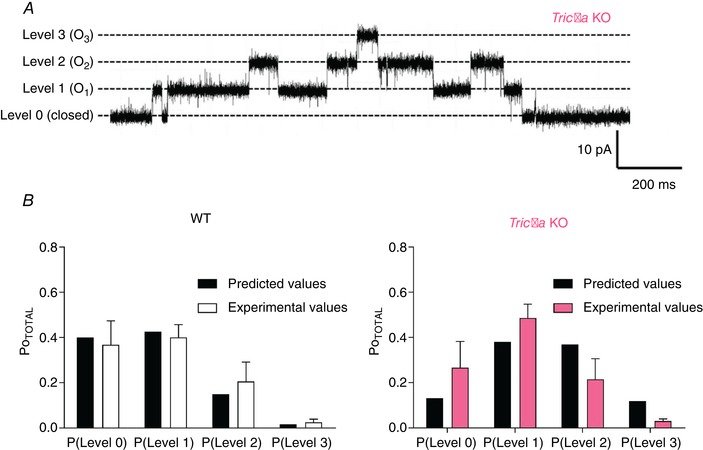
Figure 5. Binomial analysis for three SR K+‐channels in the bilayer at +30 mV.

A, a typical recording is shown where three SR K+‐channels were present in the bilayer showing the zero current level (all channels are simultaneously closed (level 0) and the levels where one (O1), two (O2) and three (O3) channels are simultaneously open. B, for experiments where three channels were present in the bilayer, the binomial statistical prediction of the probability of observing current fluctuations to each level is shown (black bars). Predicted values were calculated using the Po derived from the respective experiments where three SR K+‐channels were present in the bilayer (WT Po = 0.29, Tric‐a KO Po = 0.49) (Fig. 4 C). The white (WT) and pink (Tric‐a KO) bars represent the actual experimental data. The mean ± SEM is shown for WT (n = 7) and Tric‐a KO (n = 6). [Color figure can be viewed at wileyonlinelibrary.com]
