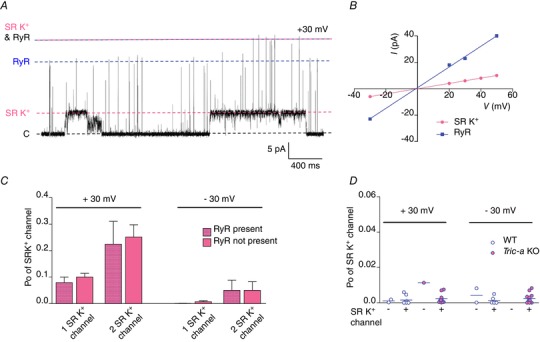
Figure 6. SR K+‐channels gating in the presence of RyR.

A, an example of a recording where an RyR and an SR K+‐channel are gating simultaneously in the bilayer. The dashed lines indicate the current levels when all channels are closed (black), or where one SR K+‐channel only (pink), one RyR channel only (blue) or both an RyR and an SR K+‐channel (blue and pink) are open. B, I–V relationships for RyR and SR K+‐channels. C, comparison of SR K+‐channel Po in the presence and absence of a RyR channel. D, comparison of RyR channel gating when activated only by 10 μm cytosolic Ca2+, for both WT and Tric‐a KO tissue at ±30 mV and in the presence and absence of SR K+‐channels. [Color figure can be viewed at wileyonlinelibrary.com]
