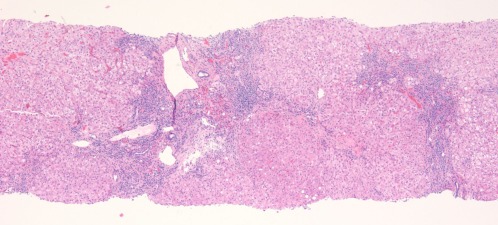
Figure 1.

AIH. This low‐magnification image (hematoxylin‐eosin, ×40) shows expanded portal tracts with effacement of the interface by a lymphoplasmacytic infiltrate including many plasma cells. The connective tissue stain shows early fibrosis and regenerative activity with 2‐cell‐thick liver plates and early nodule formation.
