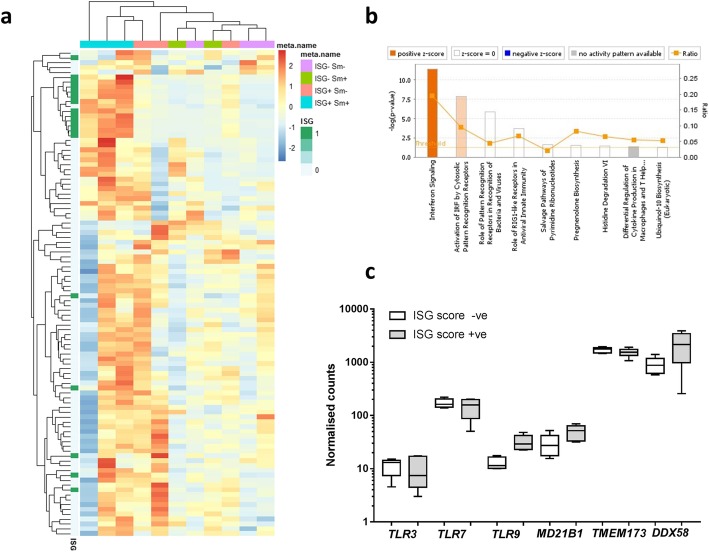
Fig. 3.
Whole blood transcriptome analysis of ISG-positive and ISG-negative SLE patients. a Heatmap of the 100 genes with the greatest variance. Upregulated genes are shown in red; downregulated genes are shown in blue. The patient samples are hierarchically clustered (Euclidean distance) over all coding genes. The heatmap is annotated to show known ISGs (dark green). Each patient sample is annotated according to the ISG score (positive or negative) and the anti-Sm antibody status (positive or negative). b Gene ontology analysis showing the canonical pathways that are over-represented in the ISG score-positive patients compared to the negative patients. c The expression of nucleic acid receptors (NARs) within the RNA-Seq dataset between the ISG score-positive (n = 6) and ISG score-negative (n = 5) patients

