
Fig. 5.
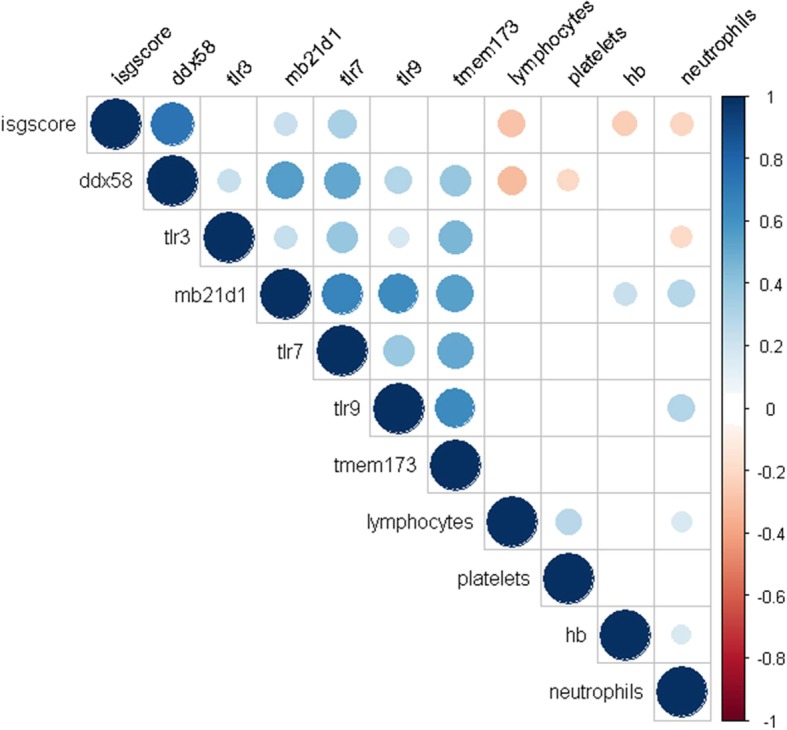
Correlation between the ISG score, NARs and haematological parameters. The figure shows a Spearman correlation matrix for the ISG score, NAR expression and haematological parameters. Only statistically significant (p < 0.05) parameters are shown. The size of the dot represents the strength of correlation (Spearman’s r); blue = positive correlation, red = negative correlation. Hb = haemoglobin