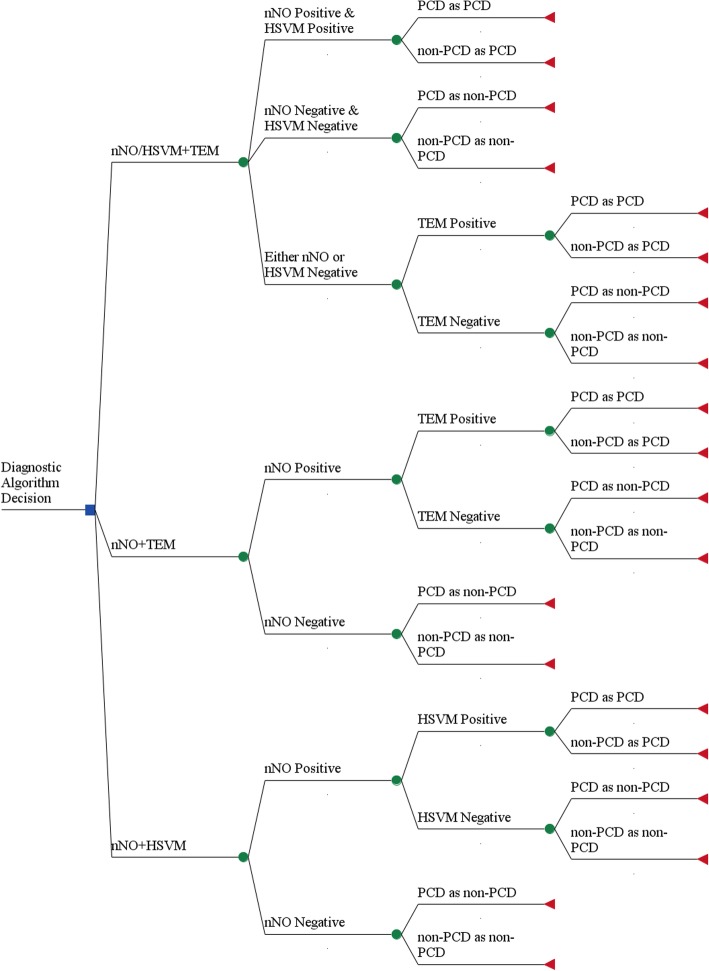
Fig. 1.
Decision Tree diagram for the three different diagnostic algorithms for PCD. The decision tree begins from the left side and the decision whether to perform nNO + TEM, nNO + HSVM or nNO/HSVM+TEM. Squares represent decision nodes, circles represent chance nodes and triangles represent outcome nodes

