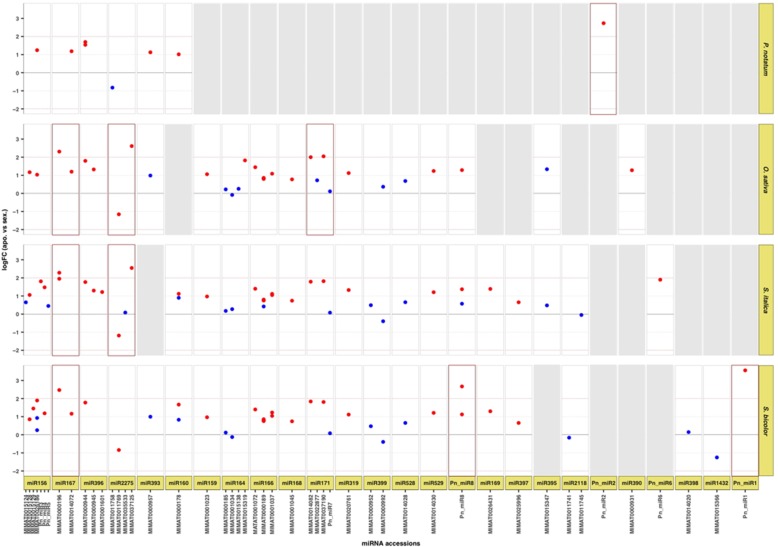
Fig. 4.
Differential expression of predicted miRNA genes. Panels summarize coverage comparative analysis for predicted miRNA clusters ordered by miRNA families and members (x-axis). The references used were indicated on the right side of the panel series. Each dot indicates significance (red: FDR < 0.05; blue: FDR > 0.05). The log2 fold change (y-axis) was obtained from the edgeR analysis. miRNA members are indicated by using miRbase [48] annotations for conserved mature miRNAs. Magenta-boxed panels display miRNA families with at least one predicted cluster with more than four-fold expression change. Grey boxes: no cluster predicted

