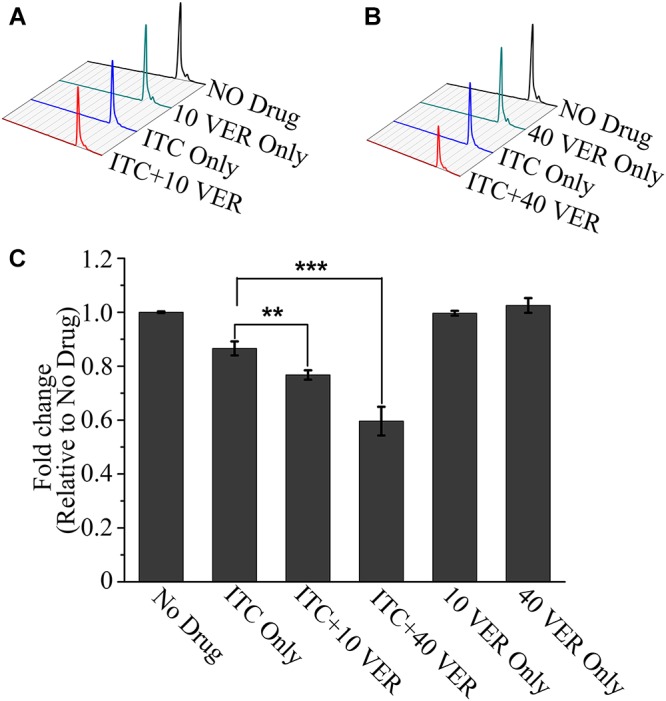
Figure 4.

HPLC assay showing a decrease in ergosterol in the ITC-VER combination. (A,B) Ergosterol was extracted from the A. fumigatus strain treated with 0.02 μg/ml ITC and 10 μg/ml (A) or 40 μg/ml (B) VER for 24 h and then measured by HPLC. (C) Normalized quantification and comparison of ergosterol contents. The bar graph is shown as a percentage relative to the No Drug group. Error bars in the graph represent standard deviations from triplicate experiments. ∗∗p < 0.0l; ∗∗∗p < 0.001.
