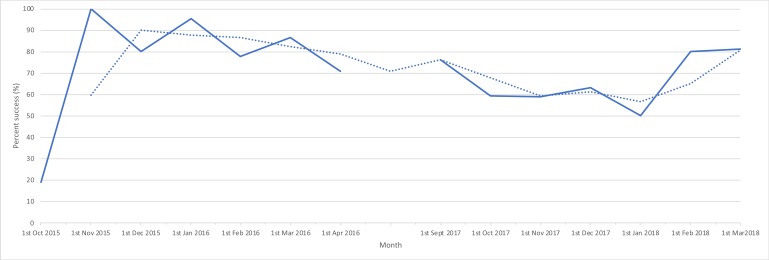
Figure 3.
Run chart: day 1 discharge success rate on fast-track protocol during sustainability re-audit. Run chart to demonstrate trends in day 1 discharge success rate over time period 1 September 2017 to 1 March 2018, in comparison with quality improvement project period of 1 October 2015 to 1 April 2016. Raw data (solid line) and average fit (dotted line).

