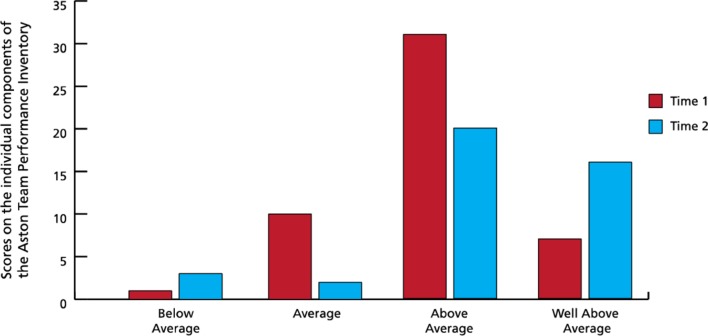
Figure 2.
Bar chart showing improvement in Team A’s performance before and after completion of the quality improvement project. Scores on the individual components of the Aston Team Performance Inventory. Performance of the team in comparison to similar teams before and after participation in the quality improvement project.

