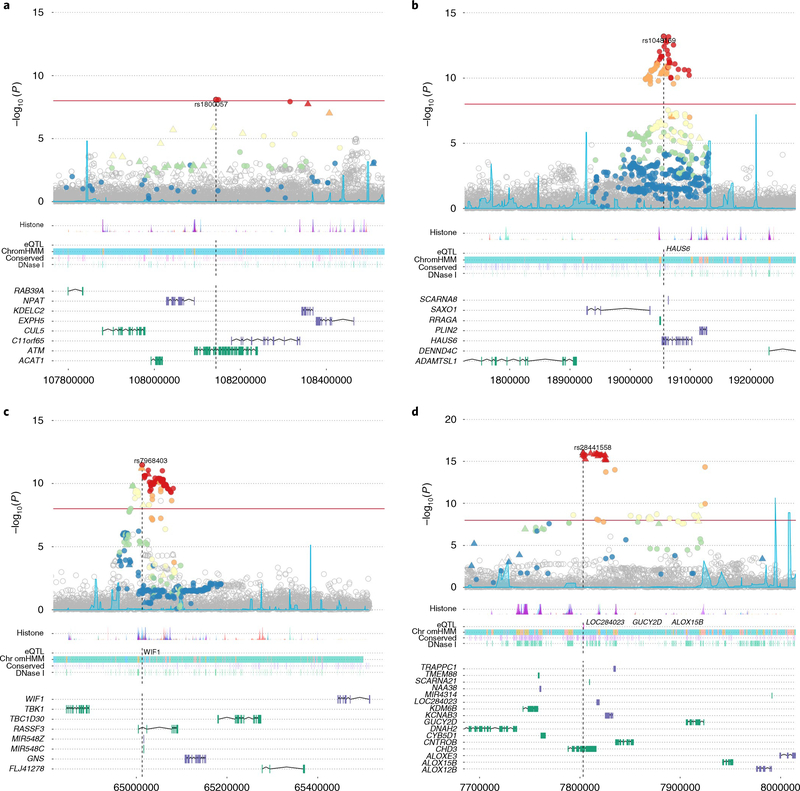
Fig. 2 |. Locus Explorer plots depicting the statistical association with PrCa and biological context of variants from four of the newly identified PrCa-risk loci (n = 74,849 biologically independent samples).
a-d, Top, Manhattan plots of variant −log10 P values (y axis), with the Index SNP labeled. Variants that were directly genotyped with the OncoArray are represented as triangles, and imputed variants are represented as circles. Variants in LD with the index SNP are denoted by color (red, r2 >0.8; orange, 0.6 < r2 < 0.8; yellow, 0.4 < r2 < 0.6; green, 0.2 < r2 < 0.4, blue, r2 ≤0.2). Middle, relative locations of selected biological annotations: histone marks within seven cell lines from the ENCODE project; genes for which the index SNP is an eQTL in TCGA prostate adenocarcinoma dataset; chromatin state annotation by ChromHMM in PrEC cells; conserved elements within the genome; and DNAse I-hypersensitivity sites in ENCODE prostate cell lines. Bottom, positions of genes within the region, with genes on the positive and negative strands marked in green and purple, respectively. The horizontal axis represents genomic coordinates in the hg19 reference genome. a, rs1800057 (chromosome (chr) 11: 107643000–108644000). The index variant is a nonsynonymous SNP in ATM. b, rs1048160 (chr 9: 18556000–19557000). The index variant is located within the 3′ UTR of HAUS6 and is an eQTL for HAUS6. c, rs7968403 (chr 12: 64513000–65514000). The signal is centered on RASSF3, and the index variant is located within the first intron. This SNP is also situated within a region annotated for multiple regulatory markers and is an eQTL for the more distant WIF1 gene. d, rs28441558 (chr 17: 7303000–8304000). The signal implicates a cluster of highly correlated variants centered on CHD3. The index SNP is also an eQTL for three other more distantly located genes.

