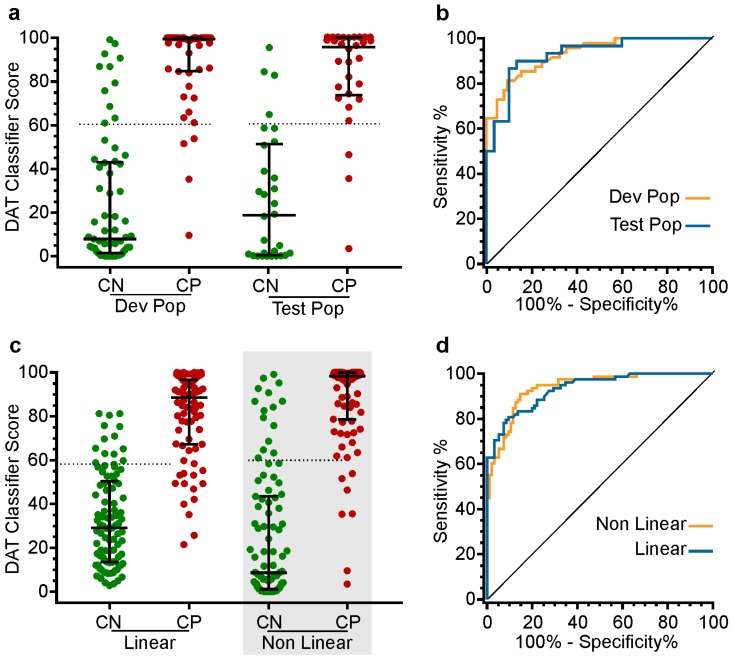
Figure 2.
(a) Shows the scores from the non-linear classifier as applied to the construction set (left pair) and the test set (right pair). Green circles represent PwP cases clinically classed as CN, whereas the red circles represent PwP cases clinically classed as CP. (b) Shows the outputs of the receiver operator statistic applied to the scores in Figure 2a. The orange curve shows the construction set and the blue line shows the test population. (c) Shows the scores from the linear and non-linear classifier when applied to the whole set. The grey shading around the non-linear classifier is to indicate that it was renamed the DAT classifier Score. (d) Shows the receiver operating characteristic (ROC) curve applied to the two groups of data shown in Figure 2c.

